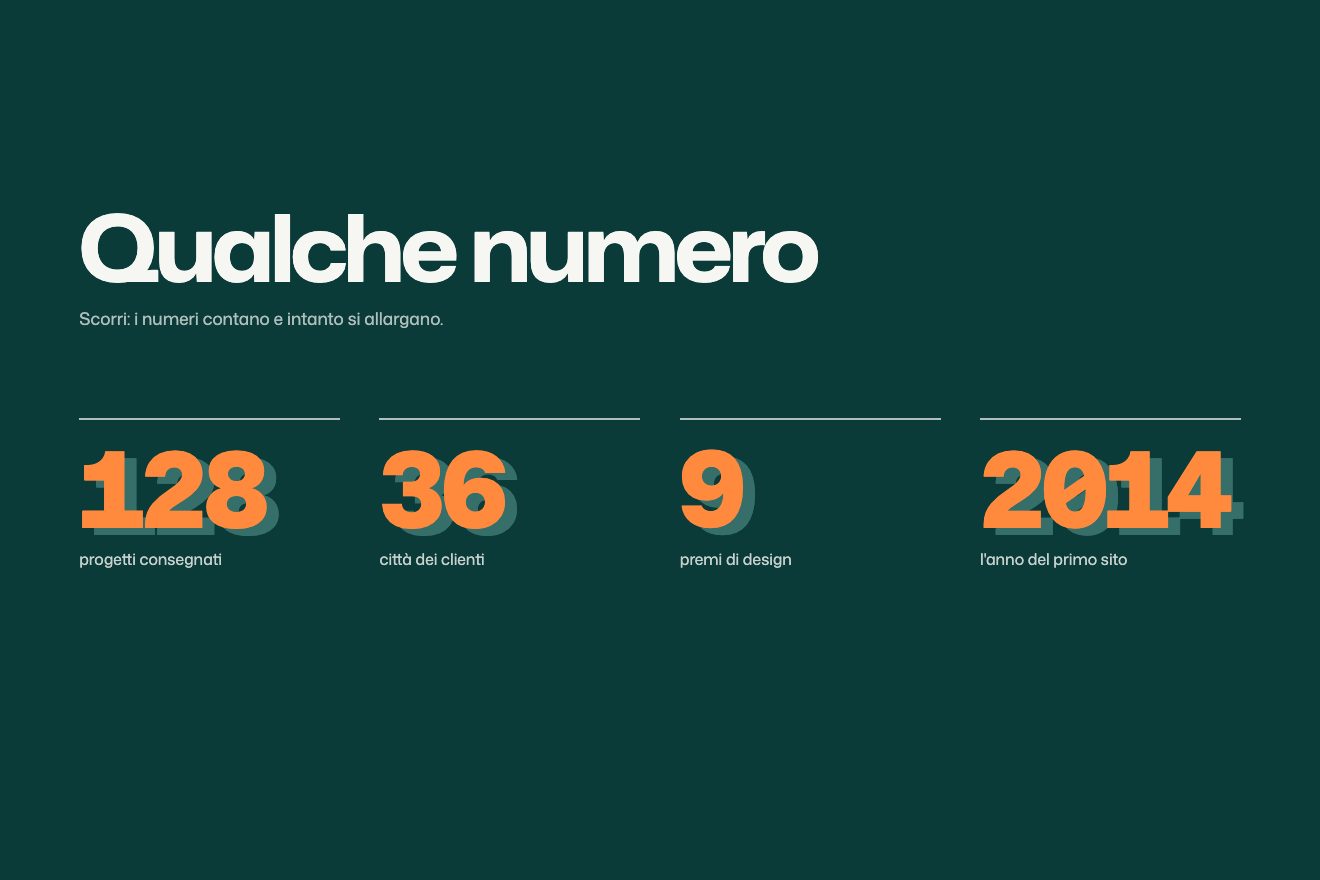
Long shadow letters
Text, Scroll, 3D
Scroll inside the preview
The features section of a team tool, in the clean style of product interfaces: six rounded tiles start gathered in the middle and, as you scroll, travel to their places in a bento grid one after the other on a short spring. Each tile starts its own small live piece the moment it lands: the revenue chart, the teammates, the switch, the rolling digits, the search that types itself, the routes between regions.
A folder that runs on its own: index.html, style.css, script.js and the libraries from a CDN. The React and Vue tabs hold the same demo as a ready component, which switches its animations off when it leaves the page.
<!doctype html>
<!--
  "Scroll bento grid" from Animorio · https://animorio.com
  License: free on your own sites and your clients’ sites, paid work included.
  Not for resale, redistribution, templates or code collections · https://animorio.com/en/license/
-->
<html lang="en">
<head>
  <meta charset="utf-8">
  <meta name="viewport" content="width=device-width, initial-scale=1">
  <title>Vantro</title>
  <link rel="stylesheet" href="https://cdn.jsdelivr.net/npm/@fontsource-variable/mona-sans@5.3.0/wdth.css">
  <link rel="stylesheet" href="style.css">
</head>
<body>
  <!-- the features section of a made-up team tool, Vantro. The stage sticks while you scroll: six rounded tiles of
       different sizes come out from the middle and settle into a bento grid, and each one starts its small live piece
       as it lands: a chart that draws itself, a row of teammates, a switch, a rolling number, a search that types,
       routes between regions -->
  <main>
    <section class="corsa" data-corsa>
      <div class="palco" data-palco>
        <header class="testa">
          <p class="testa__nota">Vantro for teams</p>
          <h2 class="testa__titolo">Everything you ship, <span>in one place</span></h2>
        </header>

        <div class="bento" data-bento>
          <article class="tessera tessera--grafico" data-tessera="grafico">
            <div class="tessera__dentro">
              <div class="riga">
                <p class="etichetta">Revenue</p>
                <p class="variazione"><svg viewBox="0 0 12 12" aria-hidden="true"><path d="M2 8.5 6 4.5l4 4"/></svg>12.4%</p>
              </div>
              <p class="cifra cifra--grande" data-ricavi>$0</p>
              <div class="grafico" data-grafico>
                <svg viewBox="0 0 320 120" preserveAspectRatio="none" aria-hidden="true">
                  <defs>
                    <linearGradient id="area" x1="0" y1="0" x2="0" y2="1">
                      <stop offset="0" stop-color="var(--accento)" stop-opacity=".22"/>
                      <stop offset="1" stop-color="var(--accento)" stop-opacity="0"/>
                    </linearGradient>
                  </defs>
                  <g class="griglia-linee">
                    <path d="M0 30H320M0 60H320M0 90H320"/>
                  </g>
                  <path class="area" data-area d=""/>
                  <path class="linea" data-linea d=""/>
                  <line class="cursore" data-cursore x1="0" y1="0" x2="0" y2="120"/>
                </svg>
                <div class="suggerimento" data-suggerimento>
                  <span data-sugg-valore>$48.2k</span>
                  <span class="suggerimento__data" data-sugg-data>Oct 24</span>
                </div>
              </div>
            </div>
          </article>

          <article class="tessera tessera--persone" data-tessera="persone">
            <div class="tessera__dentro">
              <p class="etichetta">Shared with</p>
              <div class="volti" data-volti>
                <span class="volto" style="--c:#e0e7ff">MO</span>
                <span class="volto" style="--c:#fce7f3">TL</span>
                <span class="volto" style="--c:#dcfce7">IP</span>
                <span class="volto" style="--c:#fef3c7">RS</span>
                <span class="volto volto--altri">+8</span>
              </div>
              <p class="nota">12 people in Design</p>
            </div>
          </article>

          <article class="tessera tessera--interruttore" data-tessera="interruttore">
            <div class="tessera__dentro">
              <div class="riga">
                <p class="etichetta">Auto-deploy</p>
                <button class="interruttore" type="button" role="switch" aria-checked="false" aria-label="Auto-deploy" data-interruttore>
                  <span class="interruttore__pomello"></span>
                </button>
              </div>
              <p class="nota" data-nota-deploy>Off. Deploys wait for you</p>
            </div>
          </article>

          <article class="tessera tessera--numero" data-tessera="numero">
            <div class="tessera__dentro">
              <div class="riga riga--alto">
                <div>
                  <p class="etichetta">Uptime, last 90 days</p>
                  <p class="cifra cifra--media" data-uptime aria-label="99.98%"></p>
                </div>
                <div class="barre" data-barre aria-hidden="true"></div>
              </div>
            </div>
          </article>

          <article class="tessera tessera--ricerca" data-tessera="ricerca">
            <div class="tessera__dentro">
              <div class="campo">
                <svg viewBox="0 0 20 20" aria-hidden="true"><circle cx="9" cy="9" r="5.5"/><path d="m13.2 13.2 3.8 3.8"/></svg>
                <span class="campo__testo" data-scritta></span><span class="campo__cursore" data-cursore-testo></span>
                <kbd><svg viewBox="0 0 16 16" aria-hidden="true"><path d="M6 6V4.5A1.5 1.5 0 1 0 4.5 6H11.5A1.5 1.5 0 1 0 10 4.5V11.5A1.5 1.5 0 1 0 11.5 10H4.5A1.5 1.5 0 1 0 6 11.5Z"/></svg>K</kbd>
              </div>
              <ul class="risultati" data-risultati>
                <li><span class="risultati__icona"><svg viewBox="0 0 16 16"><path d="M4 2.5h5l3 3v8H4z M9 2.5v3h3"/></svg></span>Invoice INV-0311, March<span class="risultati__nota">Finance</span></li>
                <li><span class="risultati__icona"><svg viewBox="0 0 16 16"><path d="M4 2.5h5l3 3v8H4z M9 2.5v3h3"/></svg></span>All March invoices<span class="risultati__nota">Report</span></li>
              </ul>
            </div>
          </article>

          <article class="tessera tessera--mappa" data-tessera="mappa">
            <div class="tessera__dentro">
              <div class="riga">
                <p class="etichetta">Edge regions</p>
                <p class="nota nota--destra" data-latenza>38 ms</p>
              </div>
              <svg class="mappa" viewBox="0 0 280 110" preserveAspectRatio="xMidYMid meet" aria-hidden="true" data-mappa>
                <g class="mappa__fondo" data-fondo></g>
                <path class="rotta" data-rotta d="M46 58 C 90 18, 140 18, 170 46"/>
                <path class="rotta" data-rotta d="M170 46 C 196 22, 226 26, 238 52"/>
                <path class="rotta" data-rotta d="M170 46 C 172 70, 160 86, 150 88"/>
                <rect class="nodo" data-nodo x="42" y="54" width="8" height="8" rx="2"/>
                <rect class="nodo" data-nodo x="166" y="42" width="8" height="8" rx="2"/>
                <rect class="nodo" data-nodo x="234" y="48" width="8" height="8" rx="2"/>
                <rect class="nodo" data-nodo x="146" y="84" width="8" height="8" rx="2"/>
              </svg>
            </div>
          </article>
        </div>
      </div>
    </section>

    <footer class="piede">
      <p>Vantro keeps your team’s work in one calm place.</p>
    </footer>
  </main>

  <script src="https://cdn.jsdelivr.net/npm/gsap@3.15.0/dist/gsap.min.js"></script>
  <script src="https://cdn.jsdelivr.net/npm/gsap@3.15.0/dist/ScrollTrigger.min.js"></script>
  <script src="https://cdn.jsdelivr.net/npm/lenis@1.3.26/dist/lenis.min.js"></script>
  <script src="script.js"></script>
</body>
</html>Change values, colours and text with the controls and watch the animation respond live. Or write in the code yourself. Then download the folder with your changes.
43 values to change
With the Animorio connector, Claude Code, ChatGPT, Cursor or VS Code take it from here, guide included, and fit it into your project. Paste this request:
Take “Scroll bento grid” from Animorio and fit it into my siteThe bento grid is CSS Grid with named areas (a a b c / a a d d / e e f f; two columns on the phone). The tiles already sit in place: GSAP only moves them towards the middle, measuring for each the distance between its centre and the grid’s with offsetLeft and offsetTop, which ignore transforms. The values are functions and the ScrollTrigger has invalidateOnRefresh: every resize measures again.
A paused timeline holds one fromTo per tile, STAGGER apart, with back.out(SETTLE): the spring that overshoots and comes back. ScrollTrigger drives it with a 0.6 second scrub from top to bottom of the 340vh section; the stage is sticky and 100vh tall. Lenis does the smooth scrolling.
Each piece has three functions: rest, start and end. The check lives on the timeline’s onUpdate, not the scroll’s: the scrub keeps moving the grid after the wheel stops, and the tile should light up when it really lands. Below its arrival, with a small margin, the piece goes back to rest.
The line is a path of Bézier curves built from the thirty values, drawn with stroke-dashoffset (with vector-effect: non-scaling-stroke the dashes are in screen pixels, so the dash is 4000 long rather than the path length); the area is the same path closed with a gradient. The tooltip sits above its point by measuring the chart box. The digits of 99.98% are columns holding 0 to 9 twice, moved with yPercent to the right digit, each a little slower than the one before.
The search types the query with a growing counter that cuts the text; the caret blinks with steps(1). The switch stretches to the right before it snaps, with back.out. The map is a grid of tiny squares kept only inside five ellipses, the routes are paths drawn with stroke-dashoffset and the nodes are rounded squares that grow when their route arrives.
| Name | File | Default | What it changes |
|---|---|---|---|
RIDE | script.js | 1 | How much scroll the grid takes to assemble: 2 is twice as long. |
SPREAD | script.js | 1 | How close to the middle the tiles start: 1 all in the middle, 0 already in place. |
STAGGER | script.js | 0.1 | The gap between one tile and the next, as a share of the scroll. |
SETTLE | script.js | 1.4 | How much each tile overshoots its place before it settles. |
LIVE | script.js | 1 | The speed of the live pieces inside the tiles. |
For the features section of a SaaS landing page, a team app or a dashboard tool: the bento grid tells six things in a single screen, and the live pieces show the product at work instead of describing it.
The same animation with adapted sizes: the grid becomes two columns and four rows and fits the box, the headline gets smaller, the search keeps a single result and the chart tooltip is hidden.
The tiles are already in place and fade in; the pieces sit in their final state (the chart drawn, the switch on, 99.98%, the search typed, the routes), with no movement.
GSAP 3.15.0, ScrollTrigger 3.15.0, Lenis 1.3.26, Mona Sans (font variabile) 5.3.0.
Compressed with gzip, the three demo files weigh 9.5 KB; the libraries: GSAP + ScrollTrigger 45 KB, Lenis 5.3 KB.
Tested on 25 October 2026
Use it in your own projects and in your clients’ projects. Do not resell it or redistribute it as is. GSAP stays under its own Standard license. Full license.
Support Animorio
Animorio stays free thanks to the people who support it. If you like, buy us a coffee: it helps us make the next animations.
You asked for
We made it for you: it’s in the library, with the preview, the Playground and the code to copy.
An animation you can’t find, or a site to take apart in the journal: tell us which. We pick the next ones from here.
With your account’s email and password.
or with your email
You’re signed in as .
With your account, you can download the zip of every animation and every pack, for free.