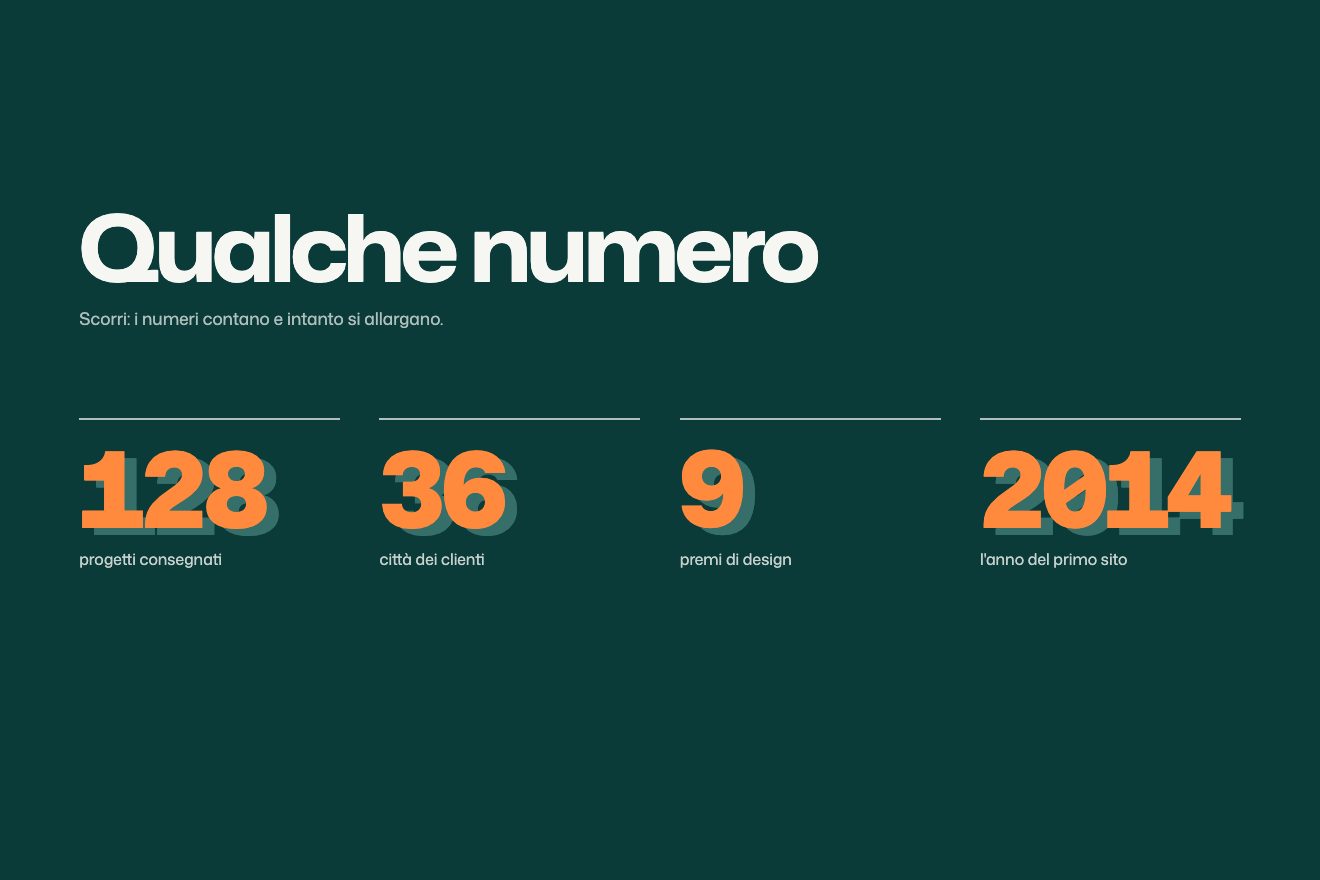
Long shadow letters
Text, Scroll, 3D
Scroll inside the preview
The pricing section of a made-up analytics app, Plotwell, in the premium product style: on a near black page a dark panel with the comparison table of the three plans stays put and the scroll fills it in. The column heads rise, every feature row comes in with its rule, its values and its checks drawing themselves, and a violet light runs down the recommended column one row at a time. Then the switch goes from monthly to yearly and the prices roll digit by digit; at the end the recommended column takes the light: a beam goes round its edge, the Recommended label drops in and the trial button shines.
A folder that runs on its own: index.html, style.css, script.js and the libraries from a CDN. The React and Vue tabs hold the same demo as a ready component, which switches its animations off when it leaves the page.
<!doctype html>
<!--
  "Plan comparison" from Animorio · https://animorio.com
  License: free on your own sites and your clients’ sites, paid work included.
  Not for resale, redistribution, templates or code collections · https://animorio.com/en/license/
-->
<html lang="en">
<head>
  <meta charset="utf-8">
  <meta name="viewport" content="width=device-width, initial-scale=1">
  <title>Plotwell pricing</title>
  <link rel="stylesheet" href="https://cdn.jsdelivr.net/npm/@fontsource-variable/mona-sans@5.3.0/wdth.css">
  <link rel="stylesheet" href="style.css">
</head>
<body>
  <!-- the pricing section of a made-up product analytics tool, Plotwell. The stage sticks while you scroll and the
       comparison of the three plans fills itself in: the columns rise, every feature row comes in with its values and
       its checks, and a light runs down the recommended column row by row. Then the switch goes from monthly to
       yearly and every price rolls to the new one; at the end the recommended column takes the light: a beam goes
       round its edge, the label drops in and the trial button catches a shine. -->
  <main>
    <section class="prezzi" data-prezzi>
      <div class="palco" data-palco>
        <div class="alone" data-alone aria-hidden="true"></div>
        <div class="grana" aria-hidden="true"></div>

        <div class="spazio" data-spazio>
          <div class="cornice" data-cornice>
            <article class="pannello" data-pannello>
              <span class="pannello__luce" aria-hidden="true"></span>

              <header class="capo" data-capo>
                <div class="capo__testo">
                  <p class="capo__marchio">
                    <svg viewBox="0 0 16 16" aria-hidden="true"><path d="M2 13.5V9.2M6 13.5V5.8M10 13.5V7.6M14 13.5V2.5"/></svg>
                    Plotwell
                  </p>
                  <h2 class="capo__titolo">Compare plans</h2>
                  <p class="capo__riga">Every plan comes with unlimited projects and live dashboards.</p>
                </div>
                <div class="interruttore" data-interruttore role="group" aria-label="Billing period">
                  <span class="interruttore__pomo" aria-hidden="true"></span>
                  <span class="interruttore__voce" data-voce="0">Monthly</span>
                  <span class="interruttore__voce" data-voce="1">Yearly <em class="sconto" data-sconto>-20%</em></span>
                </div>
              </header>

              <div class="tavola" data-tavola>
                <div class="scelta" data-scelta aria-hidden="true">
                  <span class="scelta__bordo"></span>
                  <span class="scelta__chip" data-chip>
                    <svg viewBox="0 0 12 12"><path d="M6 1.2l1.3 3.1 3.3.3-2.5 2.2.8 3.3L6 8.4 3.1 10.1l.8-3.3L1.4 4.6l3.3-.3z"/></svg>
                    Recommended
                  </span>
                </div>
                <div class="faro" data-faro aria-hidden="true"><span class="faro__fronte" data-fronte></span></div>
                <!-- the cells are written by script.js from the PLANS and ROWS lists -->
              </div>
            </article>
          </div>
        </div>
      </div>
    </section>
  </main>

  <script src="https://cdn.jsdelivr.net/npm/gsap@3.15.0/dist/gsap.min.js"></script>
  <script src="https://cdn.jsdelivr.net/npm/gsap@3.15.0/dist/ScrollTrigger.min.js"></script>
  <script src="https://cdn.jsdelivr.net/npm/lenis@1.3.26/dist/lenis.min.js"></script>
  <script src="script.js"></script>
</body>
</html>Change values, colours and text with the controls and watch the animation respond live. Or write in the code yourself. Then download the folder with your changes.
24 values to change
With the Animorio connector, Claude Code, ChatGPT, Cursor or VS Code take it from here, guide included, and fit it into your project. Paste this request:
Take “Plan comparison” from Animorio and fit it into my siteThe section is 420vh tall with a 100vh sticky stage inside. Everything that happens is one paused GSAP timeline that ScrollTrigger moves forward and back with the scroll (scrub 0.7); Lenis makes the scrolling smooth.
Plans and rows are two lists at the top of the script: the cells are written into a CSS grid with the names column and three equal columns. The glass of the recommended column and the light that runs down are two items of the same grid, under the cells.
The light is a gradient cut with clip-path: inset, reading the --riempi variable; the bright line in front has its top at --riempi percent. The timeline takes --riempi one sixth further with every row, on a soft ease, so it settles under the row that just came in.
Every digit is a column with the digits 0 to 9 written twice. It always goes forward: a lower digit goes past 9, the same one spins a full turn, so the whole price rolls. The yearly prices are worked out from the discount.
The switch's knob moves with two CSS variables: --t for the place (both positions measured from the words) and --stira, which stretches it while it runs and comes back on a spring. The beam on the edge is a masked conic-gradient turned by --ang.
| Name | File | Default | What it changes |
|---|---|---|---|
RIDE | script.js | 1 | How much scroll the whole section takes: 2 = twice as much. |
GLOW | script.js | 1 | How strong the violet light behind the recommended plan is. |
BEAM | script.js | 1 | How bright the beam going round the recommended column is. |
ROLL | script.js | 1 | How long the prices take to roll, compared with the default. |
DISCOUNT | script.js | 20 | The yearly discount in percent: the yearly prices are worked out from it. |
POINTER | script.js | 1 | How much the soft light on the panel follows the pointer. |
For the pricing page of a SaaS, an analytics app, a team tool or a subscription service: the plan comparison table that reads row by row as you scroll and ends on the plan to pick.
The same animation with adapted sizes: under 600 pixels the panel switches to its narrow version (a shorter names column, smaller prices, buttons with the short label), scales to fit the box and scrolling with a finger fills it in the same way.
No scroll ride and no movement: the table is already filled in, with the yearly prices, the recommended column lit and the label in place, and the panel fades in.
GSAP 3.15.0, ScrollTrigger 3.15.0, Lenis 1.3.26, Mona Sans (font variabile) 5.3.0.
Compressed with gzip, the three demo files weigh 9.8 KB; the libraries: GSAP + ScrollTrigger 45 KB, Lenis 5.3 KB.
Tested on 1 November 2026
Use it in your own projects and in your clients’ projects. Do not resell it or redistribute it as is. GSAP stays under its own Standard license. Full license.
Support Animorio
Animorio stays free thanks to the people who support it. If you like, buy us a coffee: it helps us make the next animations.
You asked for
We made it for you: it’s in the library, with the preview, the Playground and the code to copy.
An animation you can’t find, or a site to take apart in the journal: tell us which. We pick the next ones from here.
With your account’s email and password.
or with your email
You’re signed in as .
With your account, you can download the zip of every animation and every pack, for free.