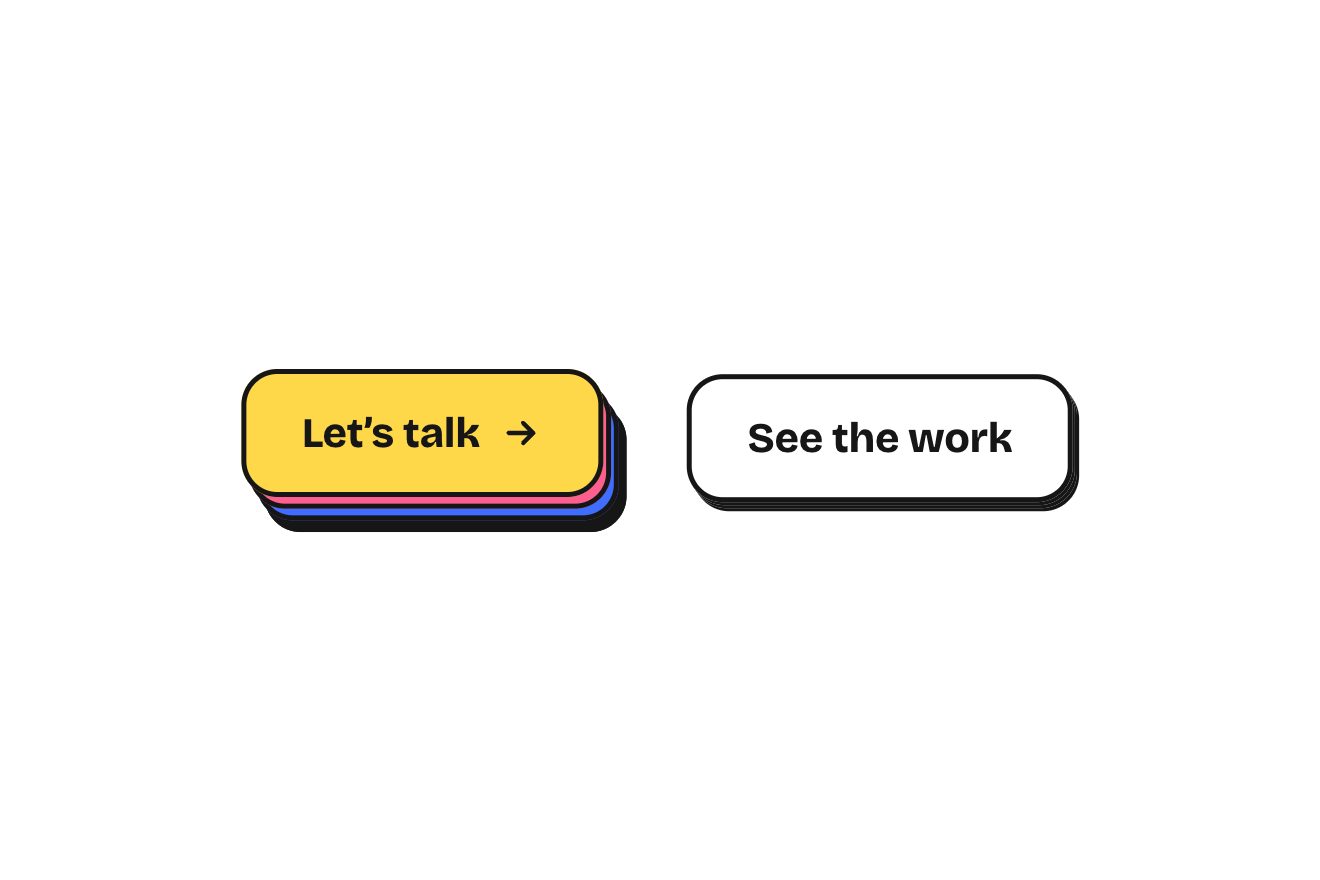
The layered button
Buttons, Hover, Physics
The weekly sales bar chart of a made-up online store, Saltmoss, in a premium card on a white page. Seven glossy bars, one a day, grow one after the other on a spring that goes a pixel too far and settles; behind each bar a dashed outline open at the foot keeps last week's figure. The Compare switch slides last week's bars out beside the new ones, they fill with a fine hatch and the change in percent appears above each pair, green or a soft red. Pointing at a day lights its bar with a rising sweep of light, the others lower and fade and a frosted glass label gives the figure and the change; the total at the top rolls digit by digit.
A folder that runs on its own: index.html, style.css, script.js and the libraries from a CDN. The React and Vue tabs hold the same demo as a ready component, which switches its animations off when it leaves the page.
<!doctype html>
<!--
  "Sales comparison chart" from Animorio · https://animorio.com
  License: free on your own sites and your clients’ sites, paid work included.
  Not for resale, redistribution, templates or code collections · https://animorio.com/en/license/
-->
<html lang="en">
<head>
  <meta charset="utf-8">
  <meta name="viewport" content="width=device-width, initial-scale=1">
  <title>The weekly sales chart with last week to compare</title>
  <link rel="stylesheet" href="https://cdn.jsdelivr.net/npm/@fontsource-variable/mona-sans@5.3.0/wdth.css">
  <link rel="stylesheet" href="style.css">
</head>
<body>
  <main class="stage" data-stage>
    <!-- the sales card of a made-up online store. Seven bars, one a day, grow one after the other on a spring; behind
         each one a dashed outline keeps last week's figure. Compare slides last week out beside this week with the
         change on top; pointing at a day lights its bar, lowers the others and a glass label gives figure and change -->
    <section class="card" data-card aria-label="Sales this week">
      <span class="card__sheen" aria-hidden="true"></span>
      <header class="card__head">
        <div class="card__id">
          <svg class="card__mark" viewBox="0 0 28 28" aria-hidden="true">
            <rect x="0.5" y="0.5" width="27" height="27" rx="8.5"></rect>
            <path d="M7.5 16.6c2.2-3.4 4.4-3.4 6.5 0s4.3 3.4 6.5 0"></path>
            <path d="M7.5 11.6c2.2-3.4 4.4-3.4 6.5 0s4.3 3.4 6.5 0"></path>
          </svg>
          <div>
            <h1 class="card__title">Sales this week</h1>
            <p class="card__sub">Saltmoss store · Nov 2 <span data-dash></span> 8</p>
          </div>
        </div>
        <button class="cmp" type="button" role="switch" aria-checked="false" data-switch>
          <span class="cmp__label">Compare</span>
          <span class="cmp__track" aria-hidden="true"><span class="cmp__knob" data-knob></span></span>
        </button>
      </header>

      <div class="total">
        <p class="total__num" data-total aria-label=""></p>
        <div class="total__side">
          <p class="pill is-up" data-total-pill>
            <svg viewBox="0 0 12 12" aria-hidden="true"><path d="M3.2 8.8 8.6 3.4M4.6 3.2h4.2v4.2"></path></svg>
            <span data-total-delta></span>
          </p>
          <p class="total__vs">vs <span data-total-then></span> last week</p>
        </div>
      </div>

      <div class="legend" aria-hidden="true">
        <span class="legend__item"><i class="legend__now"></i>This week</span>
        <span class="legend__item"><i class="legend__then"></i>Last week</span>
      </div>

      <div class="chart" data-chart tabindex="0" role="group" aria-label="Sales by day. Use the arrow keys to read a day.">
        <div class="grid" data-grid aria-hidden="true"></div>
        <span class="glow" data-glow aria-hidden="true"></span>
        <div class="bars" data-bars aria-hidden="true"></div>
        <div class="tip" data-tip aria-hidden="true">
          <div class="tip__glass" data-tip-glass>
            <p class="tip__day" data-tip-day></p>
            <p class="tip__num" data-tip-num></p>
            <p class="tip__delta" data-tip-delta>
              <svg viewBox="0 0 12 12" aria-hidden="true"><path d="M3.2 8.8 8.6 3.4M4.6 3.2h4.2v4.2"></path></svg>
              <b data-tip-pct></b><span data-tip-then></span>
            </p>
          </div>
        </div>
      </div>
      <div class="axis" data-axis aria-hidden="true"></div>
      <p class="sr" aria-live="polite" data-live></p>
    </section>

    <svg class="pointer" data-pointer viewBox="0 0 24 24" aria-hidden="true"><path d="M5 3.2 19.2 11l-6.3 1.6-3.3 5.9Z"></path></svg>
  </main>

  <script src="https://cdn.jsdelivr.net/npm/gsap@3.15.0/dist/gsap.min.js"></script>
  <script src="script.js"></script>
</body>
</html>Change values, colours and text with the controls and watch the animation respond live. Or write in the code yourself. Then download the folder with your changes.
48 values to change
With the Animorio connector, Claude Code, ChatGPT, Cursor or VS Code take it from here, guide included, and fit it into your project. Paste this request:
Take “Sales comparison chart” from Animorio and fit it into my siteThe height of every bar and outline, the fading of every day, the split of the pairs and the label's place are springs with a position, a speed and a target, kept in parts (of the value, of the day's slot) rather than pixels. One loop on GSAP's ticker steps them in 1/240 of a second, with the frame step capped at 1/30, and goes to sleep when nothing moves. GROW's damping (0.8) takes a bar about a pixel past its top before it settles.
From the springs and the chart's size the script works out at every frame the width, height and x of every bar and outline: the width is half the day's slot (between 10 and 40 pixels), the scale is the top rounded up to the thousand above the highest day. So a resize in the middle of a movement only changes the drawing, and the guides go back to their place with a ResizeObserver.
With split at 0 the dashed outline sits centred behind the bar and eight pixels wider; going to 1 both narrow to 58%, the bar slides right and the outline left by half their width plus a small gap, and the outline's hatched fill takes opacity with the same value. The SPLIT spring overshoots, so the pairs open a hair too far for an instant and close.
Above every pair a tag with the change worked out from the data, green if it rises and a soft red if it falls. Its holder is placed by the drawing (on the day's centre, seven pixels above the higher top, so it follows the bars as they grow and lower), its child is animated by GSAP: it comes in with back.out staggered by five hundredths and, on the day being read, drops to a quarter to make room for the label.
The label goes to the right of the bar in the first days and to the left in the last, at half the height of its top and always inside the chart; two springs take it there, and when it appears it starts in place. The glass is a backdrop-filter with blur and saturation over a white gradient with a one pixel edge. The bar being read takes a halo, a band of light that runs up it and a pool of light on the floor.
Every digit of the total is a column of ten numbers in a window one line tall, taken to its place with back.out from left to right. The drawn pointer is a timeline with infinite repeat and repeatRefresh, so its positions are worked out again every round; the visitor's first real gesture stops it and leaves the chart whole.
| Name | File | Default | What it changes |
|---|---|---|---|
THIS_WEEK | script.js | [2140, 2380, 2210, …] | This week's sales, Monday to Sunday. |
LAST_WEEK | script.js | [1980, 2450, 1890, …] | Last week's sales, the dashed outlines behind. |
CURRENCY | script.js | '$' | The sign before the figures. |
GROW | script.js | [170, 0.8] | The bars' spring: how stiff, and how much it is held back (1 = no overshoot). |
STAGGER | script.js | 0.07 | Seconds between one bar and the next as they grow. |
SPLIT | script.js | [210, 0.74] | The spring last week's bars slide out on when Compare is on. |
DIM | script.js | 0.55 | How much the other days fade while one is read. |
SINK | script.js | 0.06 | How much the other days lower while one is read. |
TIP | script.js | [260, 0.82] | The spring the glass label follows the day on. |
For the dashboard of an online store, the sales panel of a back office or an analytics app, or the landing page of an e-commerce product as a showcase: it shows the week at a glance and, with the comparison, which days did better or worse than the week before.
The same animation with the sizes adapted: the card is 92% of the screen wide, the chart and the total are sized on the height too (34vh, between 112 and 232 pixels), the bars stay half the day's slot and the change tags drop their decimal. With a finger you tap a day to read it and the label stays until you tap outside; the switch is tapped like a button.
Nothing moves by itself: the card fades in with the bars already at their height and the total already written, and the drawn pointer does not start. Reading a day the label fades in in its place; Compare sets the pairs side by side at once and the tags fade in.
GSAP 3.15.0, Mona Sans (font variabile) 5.3.0.
Compressed with gzip, the three demo files weigh 11 KB; the libraries: GSAP 28 KB.
Tested on 8 November 2026
Use it in your own projects and in your clients’ projects. Do not resell it or redistribute it as is. GSAP stays under its own Standard license. Full license.
Support Animorio
Animorio stays free thanks to the people who support it. If you like, buy us a coffee: it helps us make the next animations.
You asked for
We made it for you: it’s in the library, with the preview, the Playground and the code to copy.
An animation you can’t find, or a site to take apart in the journal: tell us which. We pick the next ones from here.
With your account’s email and password.
or with your email
You’re signed in as .
With your account, you can download the zip of every animation and every pack, for free.