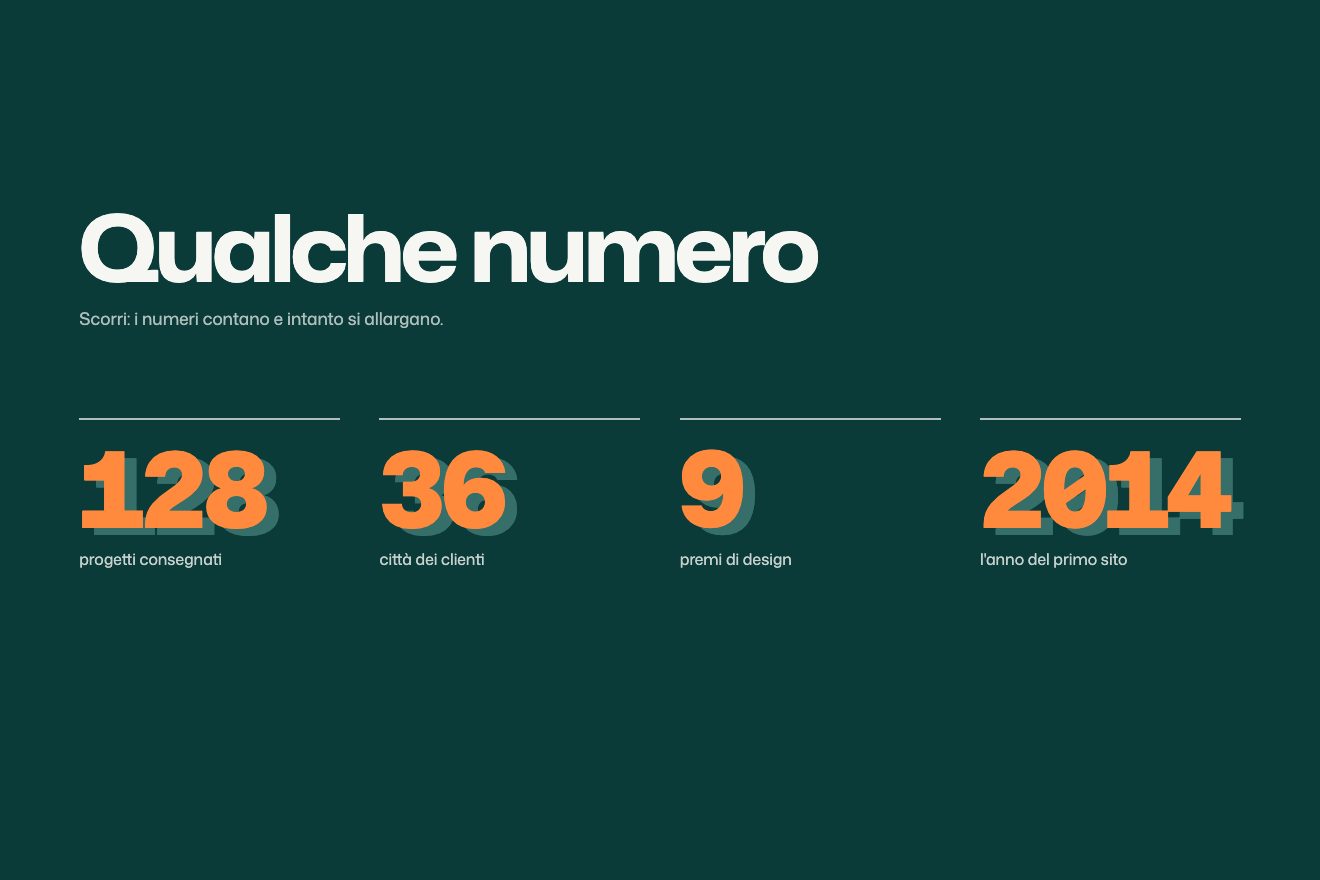
Long shadow letters
Text, Scroll, 3D
Scroll inside the preview
The landing section of a made-up running app, Pacewell, in the premium product style: on a near black page a phone stays put and the scroll replays this morning's run inside its screen. The heart rate rolls on its digits, a cursor walks along the chart, the line takes the colour of the zone it is in (easy, tempo, threshold) and that colour becomes the light the phone throws on the page and on its rim, stronger as the heart works harder. At the end the run is saved and a glass card with the summary rises.
A folder that runs on its own: index.html, style.css, script.js and the libraries from a CDN. The React and Vue tabs hold the same demo as a ready component, which switches its animations off when it leaves the page.
<!doctype html>
<!--
"Workout replay" from Animorio · https://animorio.com
License: free on your own sites and your clients’ sites, paid work included.
Not for resale, redistribution, templates or code collections · https://animorio.com/en/license/
-->
<html lang="en">
<head>
<meta charset="utf-8">
<meta name="viewport" content="width=device-width, initial-scale=1">
<title>Pacewell</title>
<link rel="stylesheet" href="https://cdn.jsdelivr.net/npm/@fontsource-variable/mona-sans@5.3.0/wdth.css">
<link rel="stylesheet" href="style.css">
</head>
<body>
<!-- the product section of a made-up running app, Pacewell. The stage sticks while you scroll: a phone waits in the
dark and the scroll replays this morning's run inside it. The heart rate rolls, the cursor walks along the chart,
the line takes the colour of the zone it is in, and that colour is the light the phone throws on the page around
it and on its own rim. At the end the run is saved and a summary card rises over the screen. -->
<main>
<section class="corsa" data-corsa>
<div class="palco" data-palco>
<div class="alone" data-alone aria-hidden="true"></div>
<div class="grana" aria-hidden="true"></div>
<div class="testo" data-testo>
<p class="testo__nota">Pacewell <span>Workout replay</span></p>
<h2 class="testo__titolo">Every beat, back in order.</h2>
<p class="testo__riga">Scroll through this morning’s run and watch your heart move through the zones, one kilometre at a time.</p>
<div class="scala" aria-hidden="true">
<div class="scala__barra">
<i class="scala__seg scala__seg--facile"></i><i class="scala__seg scala__seg--ritmo"></i><i class="scala__seg scala__seg--soglia"></i>
<svg class="scala__segno" data-segno viewBox="0 0 12 8"><path d="M1 1h10L6 7z"/></svg>
</div>
<div class="scala__nomi"><span>Easy</span><span>Tempo</span><span>Threshold</span></div>
</div>
</div>
<div class="spazio" data-spazio>
<div class="cornice" data-cornice>
<div class="telefono" data-telefono>
<div class="telefono__bordo" aria-hidden="true"></div>
<div class="schermo" data-schermo>
<div class="isola" aria-hidden="true"></div>
<div class="stato" aria-hidden="true">
<span>7:42</span>
<span class="stato__icone">
<svg viewBox="0 0 18 12"><path d="M1 11h2V8H1zM5 11h2V6H5zM9 11h2V3.5H9zM13 11h2V1h-2z"/></svg>
<svg viewBox="0 0 26 12"><rect x="1" y="1.5" width="21" height="9" rx="2.6" fill="none" stroke="currentColor" stroke-width="1"/><rect x="2.8" y="3.3" width="14" height="5.4" rx="1.4"/><path d="M23.6 4.6v2.8"/></svg>
</span>
</div>
<header class="testa">
<div>
<p class="testa__titolo">Morning run</p>
<p class="tenue">Sun, Nov 1 at 6:58 AM</p>
</div>
<span class="chip" data-chip>
<svg viewBox="0 0 12 12" aria-hidden="true"><path class="chip__play" d="M3.5 2.2v7.6L9.6 6z"/><path class="chip__ok" d="M2.6 6.2 5 8.6l4.6-5" pathLength="1"/></svg>
<span class="chip__parola" data-chip-parola>Replay</span>
</span>
</header>
<div class="battito">
<p class="etichetta">
<svg class="cuore" data-cuore viewBox="0 0 16 14" aria-hidden="true"><path d="M8 13.2 6.9 12.2C3 8.7.5 6.4.5 3.7.5 1.8 2 .4 3.9.4c1.1 0 2.2.5 2.9 1.3L8 3l1.2-1.3C9.9.9 11 .4 12.1.4 14 .4 15.5 1.8 15.5 3.7c0 2.7-2.5 5-6.4 8.5z"/></svg>
Heart rate
</p>
<div class="battito__riga">
<span class="cifre" data-cifre aria-label="142 beats per minute">
<span class="cifra" data-cifra><span class="cifra__col"><b>0</b><b>1</b><b>2</b><b>3</b><b>4</b><b>5</b><b>6</b><b>7</b><b>8</b><b>9</b></span></span><span class="cifra" data-cifra><span class="cifra__col"><b>0</b><b>1</b><b>2</b><b>3</b><b>4</b><b>5</b><b>6</b><b>7</b><b>8</b><b>9</b></span></span><span class="cifra" data-cifra><span class="cifra__col"><b>0</b><b>1</b><b>2</b><b>3</b><b>4</b><b>5</b><b>6</b><b>7</b><b>8</b><b>9</b></span></span>
</span>
<span class="battito__unita">bpm</span>
</div>
<div class="zona" data-zona>
<span class="zona__nome" data-zona-nome>Zone 1 <em>Easy</em></span>
</div>
</div>
<div class="grafico">
<svg class="grafico__svg" data-grafico viewBox="0 0 260 128" aria-hidden="true">
<defs>
<linearGradient id="colore-zone" data-sfumatura gradientUnits="userSpaceOnUse" x1="0" y1="0" x2="0" y2="128"></linearGradient>
<linearGradient id="sotto-zone" gradientUnits="userSpaceOnUse" x1="0" y1="0" x2="0" y2="128">
<stop offset="0" stop-color="#fff" stop-opacity=".22"/>
<stop offset="1" stop-color="#fff" stop-opacity="0"/>
</linearGradient>
<mask id="maschera-area"><path data-area-maschera fill="url(#sotto-zone)"/></mask>
<clipPath id="fatto"><rect data-fatto x="0" y="0" width="0" height="128"/></clipPath>
</defs>
<g class="grafico__fasce" data-fasce></g>
<path class="grafico__spenta" data-spenta/>
<g clip-path="url(#fatto)">
<rect x="0" y="0" width="260" height="128" fill="url(#colore-zone)" mask="url(#maschera-area)"/>
<path class="grafico__accesa" data-accesa stroke="url(#colore-zone)"/>
</g>
<g data-cursore>
<path class="cursore__filo" d="M0 0V128"/>
<circle class="cursore__anello" data-anello cx="0" cy="0" r="3.4"/>
</g>
</svg>
<span class="suggerimento" data-suggerimento>0:00</span>
<div class="grafico__asse tenue"><span>0:00</span><span>15:00</span><span>31:02</span></div>
</div>
<div class="dati">
<div><p class="tenue">Distance</p><p class="dati__val"><span data-distanza>0.00</span><small> km</small></p></div>
<div><p class="tenue">Pace</p><p class="dati__val"><span data-passo>0:00</span><small> /km</small></p></div>
<div><p class="tenue">Time</p><p class="dati__val"><span data-tempo>0:00</span></p></div>
</div>
<div class="zone">
<p class="tenue">Time in zones</p>
<div class="zone__barra"><i data-quota="0"></i><i data-quota="1"></i><i data-quota="2"></i></div>
<div class="zone__nomi">
<span class="zone__nome zone__nome--facile">Easy <b data-minuti="0">0:00</b></span>
<span class="zone__nome zone__nome--ritmo">Tempo <b data-minuti="1">0:00</b></span>
<span class="zone__nome zone__nome--soglia">Threshold <b data-minuti="2">0:00</b></span>
</div>
</div>
<div class="riepilogo" data-riepilogo>
<div class="riepilogo__testa">
<svg class="riepilogo__spunta" viewBox="0 0 20 20" aria-hidden="true"><circle cx="10" cy="10" r="9"/><path data-spunta d="m6 10.4 2.7 2.7L14.2 7.4" pathLength="1"/></svg>
<div>
<p class="riepilogo__titolo">Run saved</p>
<p class="tenue">Your best tempo block this month</p>
</div>
</div>
<div class="riepilogo__numeri">
<p><b>5.80</b> km</p><p><b>31:02</b> time</p><p><b>148</b> avg bpm</p>
</div>
</div>
<div class="riflesso" data-riflesso aria-hidden="true"></div>
<div class="casa" aria-hidden="true"></div>
</div>
</div>
</div>
</div>
</div>
</section>
</main>
<script src="https://cdn.jsdelivr.net/npm/gsap@3.15.0/dist/gsap.min.js"></script>
<script src="https://cdn.jsdelivr.net/npm/gsap@3.15.0/dist/ScrollTrigger.min.js"></script>
<script src="https://cdn.jsdelivr.net/npm/lenis@1.3.26/dist/lenis.min.js"></script>
<script src="script.js"></script>
</body>
</html>Change values, colours and text with the controls and watch the animation respond live. Or write in the code yourself. Then download the folder with your changes.
89 values to change
With the Animorio connector, Claude Code, ChatGPT, Cursor or VS Code take it from here, guide included, and fit it into your project. Paste this request:
Take “Workout replay” from Animorio and fit it into my siteThe heart rate is a computed curve: fifteen key points (warm up, tempo, four repeats, cool down) joined with a cosine and three small sines for noise, one point every 10 seconds. The speed comes from the heart rate and is scaled so the run is 5.80 km; the time in each zone is summed once at the start.
The chart is an SVG: the dim line underneath, the lit one on top with a clipPath as wide as the cursor. The colour is a vertical linearGradient in userSpaceOnUse with its stops right at the heights of 139 and 159 bpm: the line colours itself by zone. The area below is a rectangle with the same gradient and a mask shaped like the area.
A paused timeline takes a value from 0 to 1 and on every update draws that moment: cursor, digits, distance, pace, time, zone bars. ScrollTrigger moves it with scrub from the top to the bottom of the section, the stage is sticky and Lenis smooths the scrolling. At the end the same timeline brings up the summary card.
Each heart rate digit is a column from 0 to 9 moved with gsap.quickTo and a short back.out, so it rolls and settles. When the zone changes GSAP fades the CSS variable --luce on the html: the haze behind the phone, the 1px rim made with a mask, the heart and the label all read it; --forza follows the heart rate and makes the flare on the change.
The phone is drawn at 300 by 620 and a container scales it to fit the stage, recomputed on every resize together with the haze's position; on a phone the words go on top and only the title stays.
| Name | File | Default | What it changes |
|---|---|---|---|
RIDE | script.js | 1 | How much scroll the replay takes: 2 = twice as much. |
GLOW | script.js | 1 | How strong the zone light around the phone is. |
SPREAD | script.js | 1 | How far that light reaches on the page. |
ROLL | script.js | 0.45 | The seconds the heart rate digits take to roll. |
SHEEN | script.js | 1 | How much the glass sheen moves with the scroll and the pointer. |
SUMMARY | script.js | 1 | 1 = the summary card rises at the end, 0 = no card. |
For the landing page of a health, running or fitness app, a smartwatch or a training service: the section that shows the real product as you scroll, instead of a still screenshot.
The same animation with adapted sizes: the words go on top and only the title stays, the phone scales to fit the height left and scrolling with a finger replays the run the same way.
No scroll ride and no movement: the run is already fully replayed, with the coloured chart, the final numbers and the summary card in place, and the section fades in.
GSAP 3.15.0, ScrollTrigger 3.15.0, Lenis 1.3.26, Mona Sans (font variabile) 5.3.0.
Compressed with gzip, the three demo files weigh 11 KB; the libraries: GSAP + ScrollTrigger 45 KB, Lenis 5.3 KB.
Tested on 1 November 2026
Use it in your own projects and in your clients’ projects. Do not resell it or redistribute it as is. GSAP stays under its own Standard license. Full license.
Support Animorio
Animorio stays free thanks to the people who support it. If you like, buy us a coffee: it helps us make the next animations.
You asked for
We made it for you: it’s in the library, with the preview, the Playground and the code to copy.
An animation you can’t find, or a site to take apart in the journal: tell us which. We pick the next ones from here.
With your account’s email and password.
or with your email
You’re signed in as .
With your account, you can download the zip of every animation and every pack, for free.