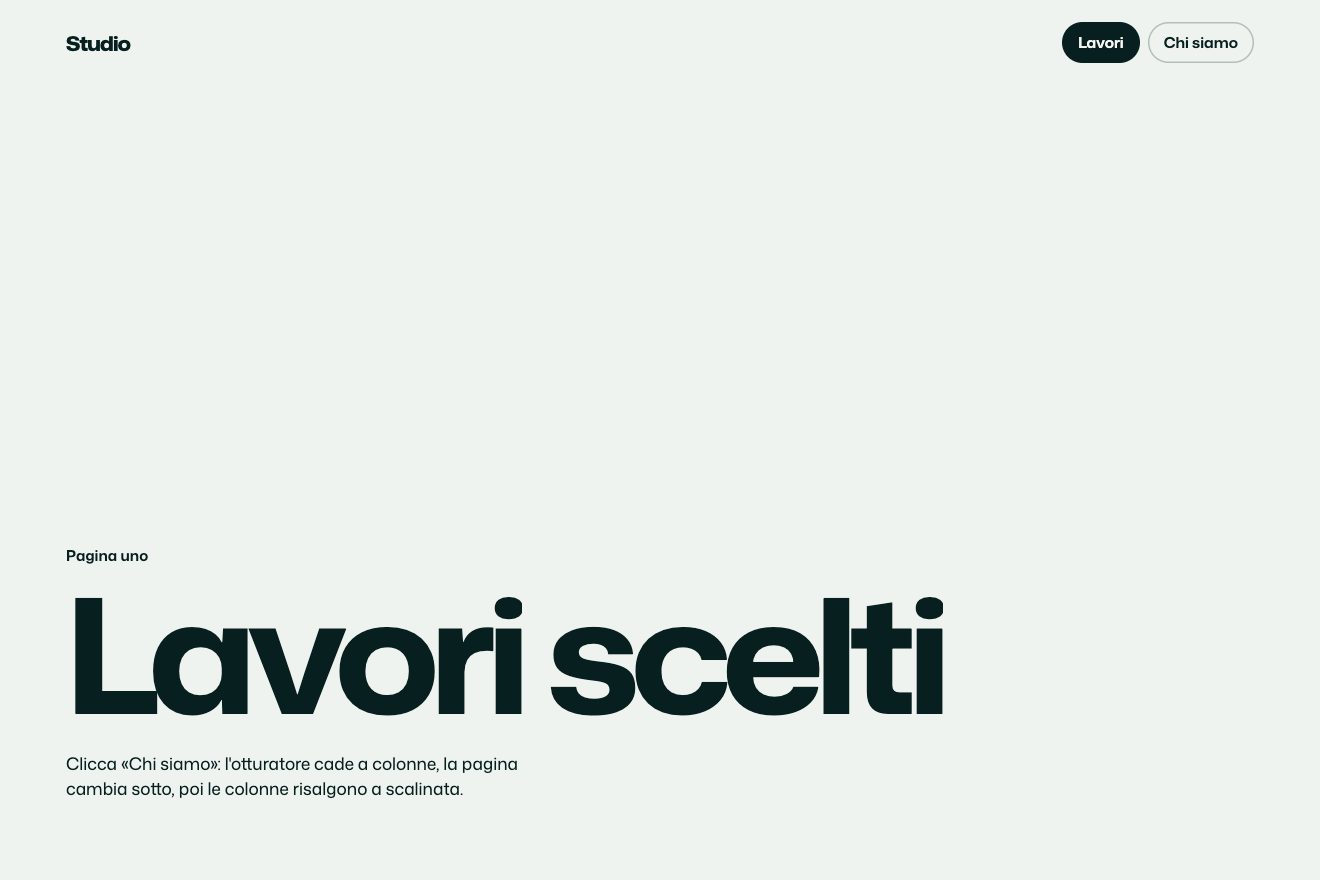
Column shutter
Transitions
A page change inside a dashboard, in the style of product components: picking a section in the sidebar, the indicator slides onto the item on a spring, a thin thread runs along the top of the window, the title leaves letter by letter and the new one rises, the old page’s cards sink and fade, the new ones rise, and the two cards both pages share move and resize to their new place while the digits roll and the curve bends.
A folder that runs on its own: index.html, style.css, script.js and the libraries from a CDN. The React and Vue tabs hold the same demo as a ready component, which switches its animations off when it leaves the page.
<!doctype html>
<!--
"Dashboard transition" from Animorio · https://animorio.com
License: free on your own sites and your clients’ sites, paid work included.
Not for resale, redistribution, templates or code collections · https://animorio.com/en/license/
-->
<html lang="en">
<head>
<meta charset="utf-8">
<meta name="viewport" content="width=device-width, initial-scale=1">
<title>Fenwick analytics</title>
<link rel="stylesheet" href="https://cdn.jsdelivr.net/npm/@fontsource-variable/mona-sans@5.3.0/wdth.css">
<link rel="stylesheet" href="style.css">
</head>
<body>
<!-- the window of an invented analytics app: changing section, the sidebar indicator slides, the title rolls,
the cards of the old page leave, the new ones arrive, and the cards both pages share move and resize (FLIP) -->
<main class="palco">
<section class="finestra" data-finestra aria-label="Fenwick analytics">
<div class="filo" data-filo aria-hidden="true"></div>
<nav class="lato" aria-label="Sections">
<p class="marchio">
<svg viewBox="0 0 20 20" aria-hidden="true"><path d="M4 15.5V8.2M8.7 15.5V4.5M13.3 15.5v-5M17 15.5H3" /></svg>
<span>Fenwick</span>
</p>
<div class="voci" data-voci>
<span class="indicatore" data-indicatore aria-hidden="true"></span>
<button class="voce" type="button" data-voce="overview" aria-current="page">
<svg viewBox="0 0 16 16" aria-hidden="true"><rect x="2.5" y="2.5" width="4.5" height="4.5" rx="1.2" /><rect x="9" y="2.5" width="4.5" height="4.5" rx="1.2" /><rect x="2.5" y="9" width="4.5" height="4.5" rx="1.2" /><rect x="9" y="9" width="4.5" height="4.5" rx="1.2" /></svg>
<span>Overview</span>
</button>
<button class="voce" type="button" data-voce="customers">
<svg viewBox="0 0 16 16" aria-hidden="true"><circle cx="6" cy="5.6" r="2.4" /><path d="M1.8 13.4c.5-2.3 2.2-3.6 4.2-3.6s3.7 1.3 4.2 3.6" /><path d="M10.6 3.4a2.3 2.3 0 0 1 0 4.4M12.2 9.9c1 .5 1.7 1.6 2 3.5" /></svg>
<span>Customers</span>
</button>
<button class="voce" type="button" data-voce="billing">
<svg viewBox="0 0 16 16" aria-hidden="true"><rect x="1.8" y="3.5" width="12.4" height="9" rx="1.8" /><path d="M1.8 6.5h12.4M4.5 10h2.5" /></svg>
<span>Billing</span>
</button>
</div>
<p class="spazio">Workspace <b>Northbeam</b></p>
</nav>
<div class="corpo">
<header class="testa">
<div>
<h1 class="titolo" data-titolo aria-live="polite">Overview</h1>
<p class="sotto" data-sotto>Last 30 days</p>
</div>
<span class="periodo">
<svg viewBox="0 0 16 16" aria-hidden="true"><rect x="2.2" y="3" width="11.6" height="10.6" rx="2" /><path d="M2.2 6.4h11.6M5.4 1.8v2.4M10.6 1.8v2.4" /></svg>
Oct 2026
</span>
</header>
<div class="griglia" data-griglia data-sezione="overview">
<!-- shared by the three pages: the main total and the chart -->
<article class="carta carta--totale" data-carta="totale" data-condivisa>
<div class="dentro">
<p class="etichetta" data-etichetta>Revenue</p>
<p class="grande"><span data-num="totale">$184,320</span></p>
<p class="delta" data-delta><svg viewBox="0 0 12 12" aria-hidden="true"><path d="M3 7.5 6 4.5l3 3" /></svg><span data-delta-testo>12.4%</span> vs last month</p>
</div>
</article>
<article class="carta carta--grafico" data-carta="grafico" data-condivisa>
<div class="dentro">
<div class="riga-alta">
<p class="etichetta" data-etichetta-grafico>Revenue over time</p>
<p class="legenda" data-legenda>Daily</p>
</div>
<svg class="curva" data-curva viewBox="0 0 300 100" preserveAspectRatio="none" aria-hidden="true">
<path class="area" data-area d="" />
<path class="linea" data-linea d="" />
</svg>
</div>
</article>
<!-- overview -->
<article class="carta carta--piccola" data-carta="utenti" data-di="overview">
<div class="dentro">
<p class="etichetta">Active users</p>
<p class="medio"><span data-num>8,412</span></p>
<p class="nota">+318 this week</p>
</div>
</article>
<article class="carta carta--piccola solo-largo" data-carta="conversione" data-di="overview">
<div class="dentro">
<p class="etichetta">Conversion</p>
<p class="medio"><span data-num>3.8%</span></p>
<div class="stecca"><i style="--p: .38"></i></div>
</div>
</article>
<!-- customers -->
<article class="carta carta--piccola" data-carta="abbandoni" data-di="customers" hidden>
<div class="dentro">
<p class="etichetta">Churn</p>
<p class="medio"><span data-num>1.9%</span></p>
<p class="nota">Down from 2.4%</p>
</div>
</article>
<article class="carta carta--tabella solo-largo" data-carta="clienti" data-di="customers" hidden>
<div class="dentro">
<p class="etichetta">Newest customers</p>
<ul class="elenco">
<li><span class="iniziali" style="--c: #e7e3ff">LR</span><span class="nome">Larchwood Roasters</span><span class="piano">Team</span><span class="cifra">$240</span></li>
<li><span class="iniziali" style="--c: #dff3ec">OS</span><span class="nome">Oxbow Studio</span><span class="piano">Pro</span><span class="cifra">$96</span></li>
<li><span class="iniziali" style="--c: #fde9dc">MQ</span><span class="nome">Mill & Quay</span><span class="piano">Team</span><span class="cifra">$240</span></li>
<li><span class="iniziali" style="--c: #e2edfb">HT</span><span class="nome">Halberd Tools</span><span class="piano">Pro</span><span class="cifra">$96</span></li>
<li><span class="iniziali" style="--c: #f3e8f7">PW</span><span class="nome">Pell & Wren</span><span class="piano">Starter</span><span class="cifra">$29</span></li>
<li><span class="iniziali" style="--c: #fbf2d8">GA</span><span class="nome">Gantry Audio</span><span class="piano">Team</span><span class="cifra">$240</span></li>
</ul>
<p class="tutti">View all customers <svg viewBox="0 0 12 12" aria-hidden="true"><path d="M4.5 2.5 8 6l-3.5 3.5" /></svg></p>
</div>
</article>
<!-- billing -->
<article class="carta carta--piccola" data-carta="fatture" data-di="billing" hidden>
<div class="dentro">
<p class="etichetta">Invoices due</p>
<p class="medio"><span data-num>14</span></p>
<p class="nota">$6,920 outstanding</p>
</div>
</article>
<article class="carta carta--piccola solo-largo" data-carta="pagamento" data-di="billing" hidden>
<div class="dentro">
<p class="etichetta">Next payout</p>
<p class="medio"><span data-num>$12,480</span></p>
<p class="nota">Arrives Oct 31</p>
</div>
</article>
<article class="carta carta--piani solo-largo" data-carta="piani" data-di="billing" hidden>
<div class="dentro">
<p class="etichetta">Revenue by plan</p>
<ul class="piani">
<li><span>Team</span><div class="stecca"><i style="--p: .58"></i></div><b>58%</b></li>
<li><span>Pro</span><div class="stecca"><i style="--p: .31"></i></div><b>31%</b></li>
<li><span>Starter</span><div class="stecca"><i style="--p: .11"></i></div><b>11%</b></li>
</ul>
<dl class="riepilogo">
<div><dt>Paying accounts</dt><dd>2,611</dd></div>
<div><dt>Annual billing</dt><dd>42%</dd></div>
<div><dt>Average per account</dt><dd>$16.03</dd></div>
</dl>
</div>
</article>
</div>
</div>
</section>
<svg class="puntatore" data-puntatore viewBox="0 0 24 24" aria-hidden="true">
<path d="M5 3.5v15.2l4.1-3.9 2.7 6.2 2.6-1.1-2.7-6.1 5.7-.3z" />
</svg>
</main>
<script src="https://cdn.jsdelivr.net/npm/gsap@3.15.0/dist/gsap.min.js"></script>
<script src="script.js"></script>
</body>
</html>Change values, colours and text with the controls and watch the animation respond live. Or write in the code yourself. Then download the folder with your changes.
90 values to change
With the Animorio connector, Claude Code, ChatGPT, Cursor or VS Code take it from here, guide included, and fit it into your project. Paste this request:
Take “Dashboard transition” from Animorio and fit it into my siteThe grid has four columns and three rows, and its data-sezione attribute picks where each card sits: in Overview the chart fills the whole bottom, in Customers half of it, in Billing the other half, and the total goes from wide to small and from left to right. Cards of a single page have data-di and the hidden attribute in the others.
Before the change, the total and the chart are measured, then data-sezione changes and they are measured again. Each card starts shifted by the difference with its old width and height, and reaches its new place with back.out: the real size is animated, not the scale, so the text inside does not stretch.
The old page’s cards sink by USCITA pixels and fade, staggered; only once they are gone does the page change, so the FLIP measurements are right. The new ones start 18 pixels lower and transparent and rise with a small bounce, and their bars fill.
Each digit is a column from 0 to 9 inside a window one line high: it moves by 10% per digit. The new column starts from the old digit that sat at the same distance from the right, so 184,320 becomes 2,947 by rolling and the rightmost digits turn a little longer.
The indicator is a white rectangle under the items: GSAP takes it to the new item’s offsetTop and offsetHeight (on the phone offsetLeft and offsetWidth) with back.out and stretches it for a moment while it travels. The thread at the top is a two pixel line that grows with scaleX and then disappears: an instant of loading inside the window, not a page bar.
| Name | File | Default | What it changes |
|---|---|---|---|
DURATA | script.js | 0.62 | How long the shared cards take to travel to their new place, in seconds. |
MOLLA | script.js | 1.15 | How far the spring overshoots the end point (1 = barely, 2 = a lot). |
USCITA | script.js | 14 | How many pixels the leaving cards sink. |
SFALSA | script.js | 0.05 | The delay between one card and the next as they arrive or leave, in seconds. |
ROTOLO | script.js | 0.7 | How long the digits take to roll to the new value, in seconds. |
SOSTA | script.js | 2.4 | How long each section stays still in the automatic tour, in seconds. |
For a dashboard, an admin panel or any app with a sidebar and pages that share something (a total, a chart, a filter): the change keeps the eye on the pieces that stay and makes clear at once what has changed.
The same transition with adapted sizes: the sidebar becomes a row of tabs at the top, with the indicator sliding sideways, and the grid has two columns, the total and a small card above and the chart below; the pages’ biggest cards only appear on wide screens.
No movement: the grid fades, the page changes and the new one fades in, with the numbers already at their value; the indicator jumps straight to the new item.
GSAP 3.15.0, Mona Sans (font variabile) 5.3.0.
Compressed with gzip, the three demo files weigh 9.9 KB; the libraries: GSAP 28 KB.
Tested on 25 October 2026
Use it in your own projects and in your clients’ projects. Do not resell it or redistribute it as is. GSAP stays under its own Standard license. Full license.
Support Animorio
Animorio stays free thanks to the people who support it. If you like, buy us a coffee: it helps us make the next animations.
You asked for
We made it for you: it’s in the library, with the preview, the Playground and the code to copy.
An animation you can’t find, or a site to take apart in the journal: tell us which. We pick the next ones from here.
With your account’s email and password.
or with your email
You’re signed in as .
With your account, you can download the zip of every animation and every pack, for free.