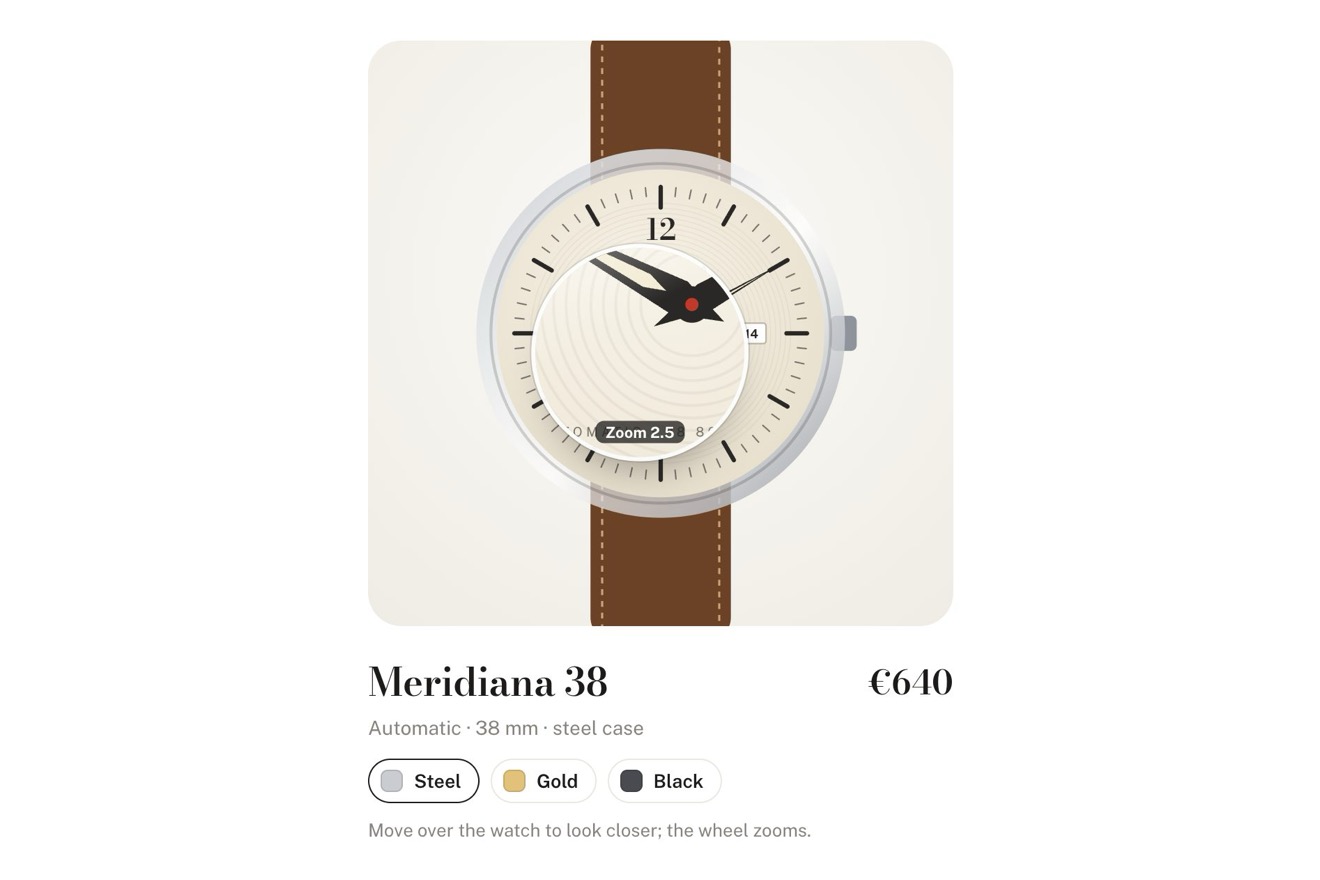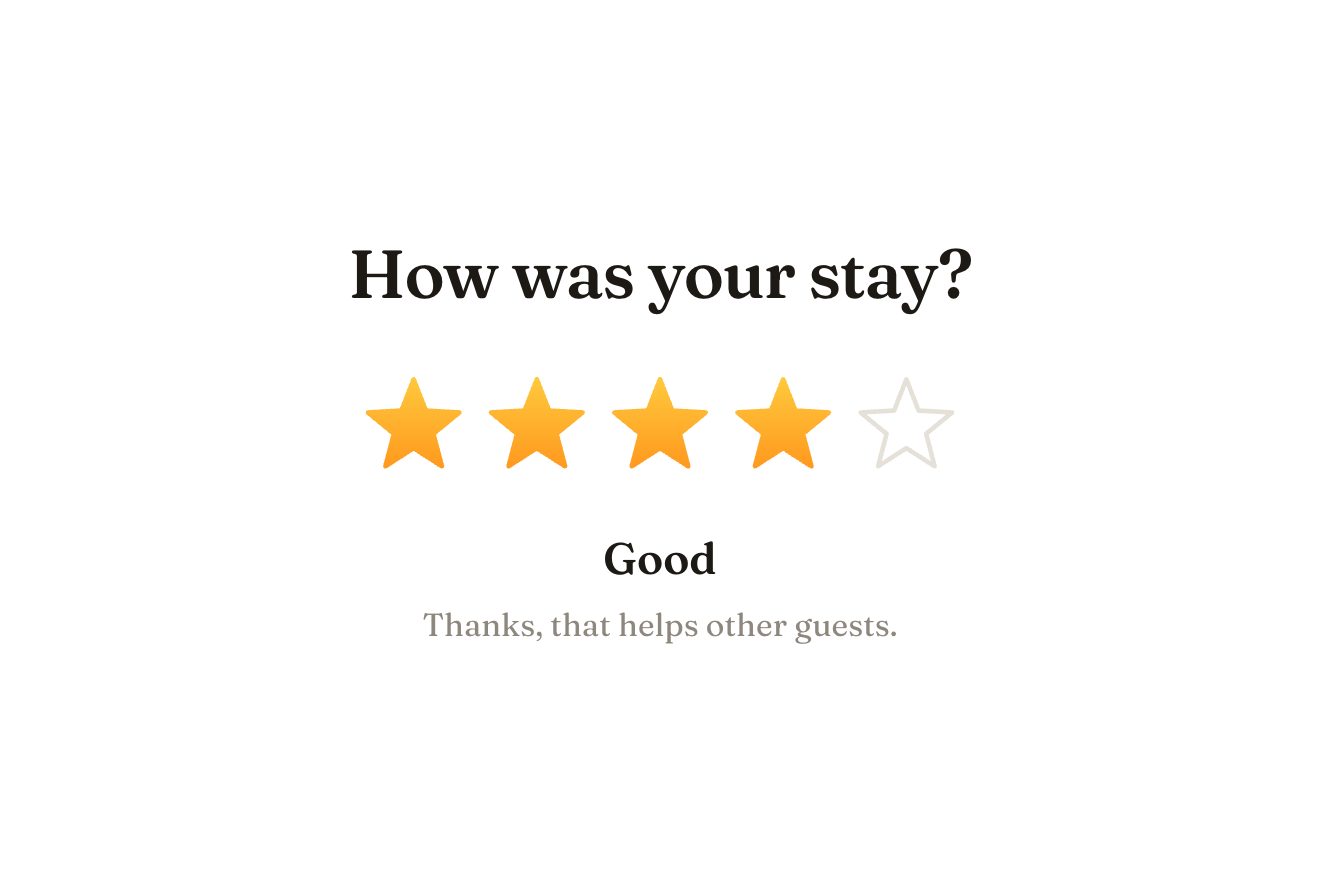
The star rating
Ratings, SVG, Hover
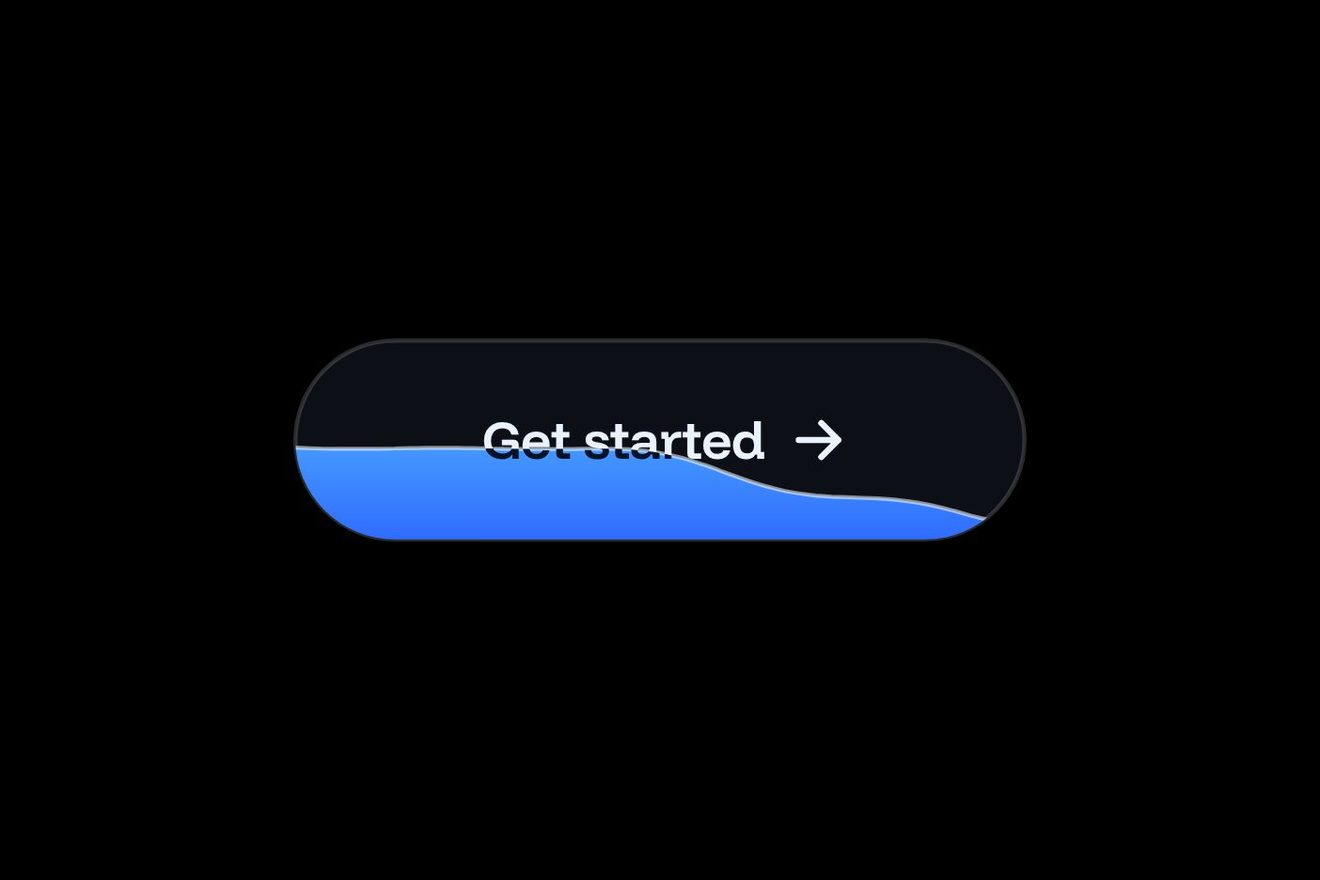
The Generate report button of a data analytics app, an ink pill on white, like a Dribbble shot: pressed, it gives and springs back and the report builds inside the button itself, as its progress: on a thin baseline one violet bar per month grows, each with a small bounce, a flash of light and a white cap, while the month rolls under Generating and the percentage counts up. At the end the bars flash and ripple, a reflection crosses the pill, the bars fold back into the baseline, the pill turns violet and the button says Open report, with a drawn document and a white disc with an arrow.
A folder that runs on its own: index.html, style.css, script.js and the libraries from a CDN. The React and Vue tabs hold the same demo as a ready component, which switches its animations off when it leaves the page.
<!doctype html>
<!--
  "Generate report button" from Animorio · https://animorio.com
  License: free on your own sites and your clients’ sites, paid work included.
  Not for resale, redistribution, templates or code collections · https://animorio.com/en/license/
-->
<html lang="en">
<head>
  <meta charset="utf-8">
  <meta name="viewport" content="width=device-width, initial-scale=1">
  <title>The Generate report button with the growing bar chart</title>
  <link rel="stylesheet" href="https://cdn.jsdelivr.net/npm/@fontsource-variable/mona-sans@5.3.0/wdth.css">
  <link rel="stylesheet" href="style.css">
</head>
<body>
  <main class="stage">
    <!-- the Generate report button of an analytics app, an ink pill on white. On hover the empty slots of the chart
         show inside it; pressed, it gives and springs back, and the report builds inside the button: one bar per
         month grows from the baseline with a small overshoot, the month rolls in the words and the percentage counts
         up. At the end the bars ripple and fold down, the pill turns violet and becomes Open report, with an arrow -->
    <div class="gr" data-wrap>
      <span class="gr__floor" data-floor aria-hidden="true"></span>
      <button class="gr__btn" type="button" data-btn aria-label="Generate report for FY 2026">
        <span class="gr__body" data-body>
          <span class="gr__clip" aria-hidden="true">
            <span class="gr__base"></span>
            <span class="gr__done" data-done-bg></span>
            <svg class="gr__chart" data-chart>
              <defs>
                <linearGradient id="gr-bar" x1="0" y1="0" x2="0" y2="1">
                  <stop offset="0" stop-color="var(--accent-hi)"/>
                  <stop offset="1" stop-color="var(--accent)" stop-opacity="0.75"/>
                </linearGradient>
                <filter id="gr-blur" data-filter filterUnits="userSpaceOnUse" x="-20" y="-20" width="340" height="100">
                  <feGaussianBlur stdDeviation="3"/>
                </filter>
              </defs>
              <line class="gr__axis" data-axis/>
              <g class="gr__slots" data-slots></g>
              <g class="gr__glows" data-glows filter="url(#gr-blur)"></g>
              <g class="gr__bars" data-bars></g>
              <g class="gr__caps" data-caps></g>
              <text class="gr__pct" data-pct text-anchor="end">0%</text>
            </svg>
            <span class="gr__shine" data-shine></span>
            <span class="gr__sweep"><span class="gr__sweep-band" data-sweep></span></span>
          </span>
          <span class="gr__rim" aria-hidden="true"></span>
          <span class="gr__row">
            <span class="gr__icon" aria-hidden="true">
              <svg viewBox="0 0 24 24">
                <path class="gr__mini-axis" data-mini-axis d="M5 19h14"/>
                <rect class="gr__mini" data-mini x="6.5" y="11" width="2.6" height="6.6" rx="1"/>
                <rect class="gr__mini" data-mini x="10.7" y="7.6" width="2.6" height="10" rx="1"/>
                <rect class="gr__mini" data-mini x="14.9" y="4.6" width="2.6" height="13" rx="1"/>
                <path class="gr__doc" data-doc pathLength="1" d="M7.4 4.2h6.2l3.9 3.9v11.2c0 .4-.3.7-.7.7H7.4c-.4 0-.7-.3-.7-.7V4.9c0-.4.3-.7.7-.7z"/>
                <path class="gr__doc gr__doc--fold" data-doc pathLength="1" d="M13.4 4.4v3.5c0 .3.2.5.5.5h3.4"/>
                <path class="gr__doc gr__doc--line" data-doc pathLength="1" d="M9.4 12.6h5.2M9.4 15.6h3.4"/>
              </svg>
            </span>
            <span class="gr__labels" aria-hidden="true">
              <span class="gr__label" data-label><span class="gr__main" data-word-rest>Generate report</span></span>
              <span class="gr__label" data-label>
                <span class="gr__main gr__main--busy" data-word-busy>Generating</span>
                <span class="gr__sub"><span data-metric>Revenue</span> · <span class="gr__roll" data-month><span>Jan</span></span></span>
              </span>
              <span class="gr__label" data-label>
                <span class="gr__main" data-word-done>Open report</span>
                <span class="gr__sub gr__sub--done"><span data-pages>PDF · 14 pages</span></span>
              </span>
            </span>
            <span class="gr__end">
              <span class="gr__chip" data-chip><span class="gr__chip-face" data-chip-face>FY 2026</span></span>
              <span class="gr__go" data-go>
                <svg viewBox="0 0 24 24"><path class="gr__go-arrow" data-go-arrow d="M8.2 15.8L15.6 8.4M9.6 8.2h6.2v6.2"/></svg>
              </span>
            </span>
          </span>
        </span>
      </button>
    </div>
    <p class="sr" aria-live="polite" data-live></p>
  </main>
  <script src="https://cdn.jsdelivr.net/npm/gsap@3.15.0/dist/gsap.min.js"></script>
  <script src="script.js"></script>
</body>
</html>Change values, colours and text with the controls and watch the animation respond live. Or write in the code yourself. Then download the folder with your changes.
29 values to change
With the Animorio connector, Claude Code, ChatGPT, Cursor or VS Code take it from here, guide included, and fit it into your project. Paste this request:
Take “Generate report button” from Animorio and fit it into my siteThe button’s body is a single box moved by GSAP (press and success); inside, a layer clipped with overflow: hidden holds the ink with its gradients, the violet layer of the ready report (only its opacity changes), the SVG chart, the light following the pointer (a radial-gradient with two CSS variables moved by gsap.quickTo) and the reflection; on top sit the edge with four inner shadows and the row with the icon, the words and the chip or the disc with the arrow, stacked in the same grid cell.
On every resize a ResizeObserver measures where Generating and the month line end (offsetLeft plus offsetWidth, even while hidden) and the chart starts 18 pixels later and ends 20 before the edge: so the bars never run under the text, on desktop or on the phone. Bar width (60% of the step), empty slots, baseline and percentage are rebuilt there.
Each bar has its own object with three numbers: how grown it is (it can pass 1 for the bounce), its light and its cap. A timeline places three tweens for each month, staggered by DURATION divided by BARS: the growth with elastic.out, the light rising in 0.12 seconds and fading in 0.7, the cap staying half a second. A single linear tween carries the percentage and the month, which rolls with yPercent only when it changes.
The heights are computed once: a rising line (GROWTH makes it more or less steep) plus two sines for the dips, then divided by the tallest so that the tallest bar reaches 96% of the chart. The drawing is redone each frame only when one of the numbers of the state has changed.
The flash of all the bars, the body to 1.016 and back with elastic.out and the slanted band crossing the pill with xPercent; then each bar goes to 1.1 and back, staggered by 30 milliseconds (the ripple), and folds to zero with power3.in while the violet layer rises. The icon’s little bars sink with scaleY, the document draws itself with pathLength 1 and strokeDashoffset, the white disc comes in with back.out. The second click sends the arrow out diagonally and brings a new one in, then everything goes back to rest.
| Name | File | Default | What it changes |
|---|---|---|---|
LABEL_REST | script.js | Generate report | The words at rest. |
LABEL_BUSY | script.js | Generating | The words while the report builds. |
LABEL_DONE | script.js | Open report | The words when the report is ready. |
METRIC | script.js | Revenue | The metric written under Generating, beside the month. |
PERIOD | script.js | FY 2026 | The chip at rest: the period of the report. |
PAGES | script.js | 14 | How many pages the ready report has. |
BARS | script.js | 12 | How many bars (12 rolls the months of the year, 4 the quarters, other numbers the weeks). |
DURATION | script.js | 3.6 | How many seconds the report takes to build. |
GROWTH | script.js | 1 | How much the bars climb from the first to the last: 0 flat, 2 steep. |
SPRING | script.js | 1 | How springy the bars and the press are: 0.4 calm, 2 very bouncy. |
HOLD | script.js | 1.2 | How many seconds Open report waits before the demo presses it by itself. |
AUTO | script.js | true | The button goes round by itself until someone touches it. |
For the main action of a data analytics app, a sales dashboard or a back office: generating a report, a statement, a monthly summary, any document that takes a few seconds. The button itself shows the work being done and becomes the link to the ready file, with no extra panel.
On the phone the button is at most 86% of the screen wide and the chart is recomputed to its size, always to the right of the words, with narrower bars; there is no hover, so the light under the finger turns on at the touch and the rest is the same.
Nothing moves: the button does not sink, the bars appear one at a time already at full height, the month and the percentage change in place, the words swap with a fade, the pill turns violet with a fade and the document and the arrow fade in.
GSAP 3.15.0, Mona Sans (font variabile) 5.3.0.
Compressed with gzip, the three demo files weigh 10 KB; the libraries: GSAP 28 KB.
Tested on 9 November 2026
Use it in your own projects and in your clients’ projects. Do not resell it or redistribute it as is. GSAP stays under its own Standard license. Full license.
Support Animorio
Animorio stays free thanks to the people who support it. If you like, buy us a coffee: it helps us make the next animations.
You asked for
We made it for you: it’s in the library, with the preview, the Playground and the code to copy.
An animation you can’t find, or a site to take apart in the journal: tell us which. We pick the next ones from here.
With your account’s email and password.
or with your email
You’re signed in as .
With your account, you can download the zip of every animation and every pack, for free.