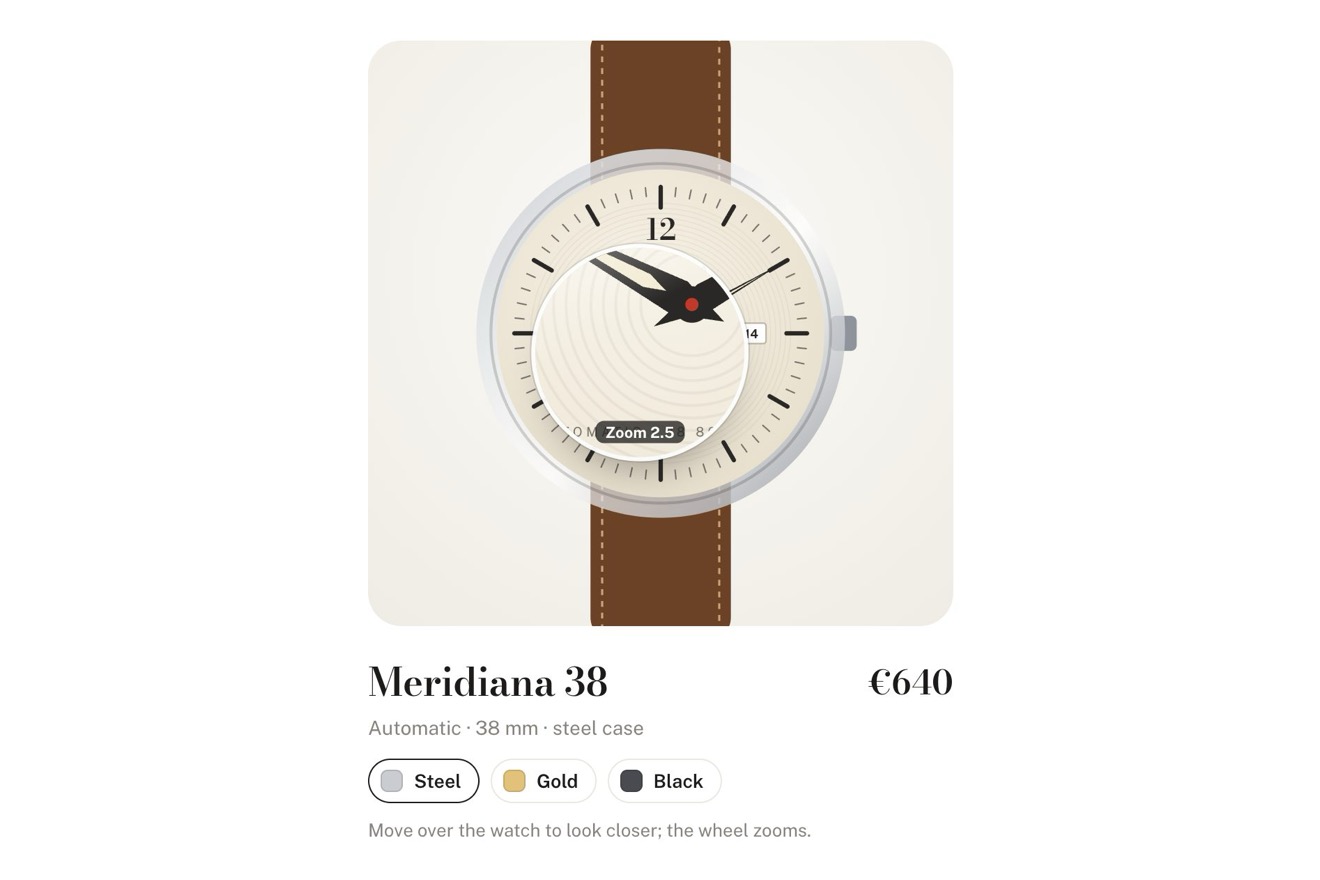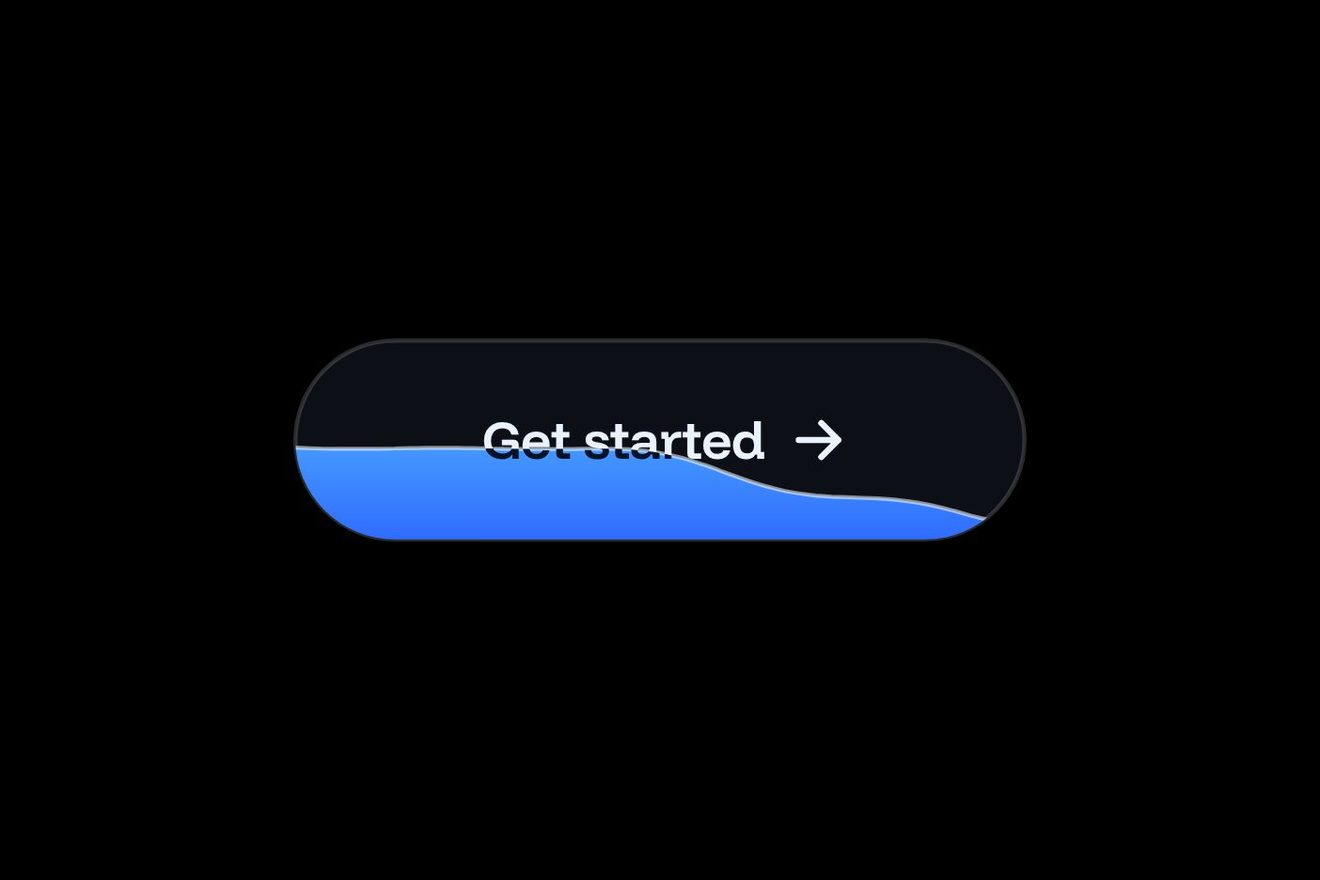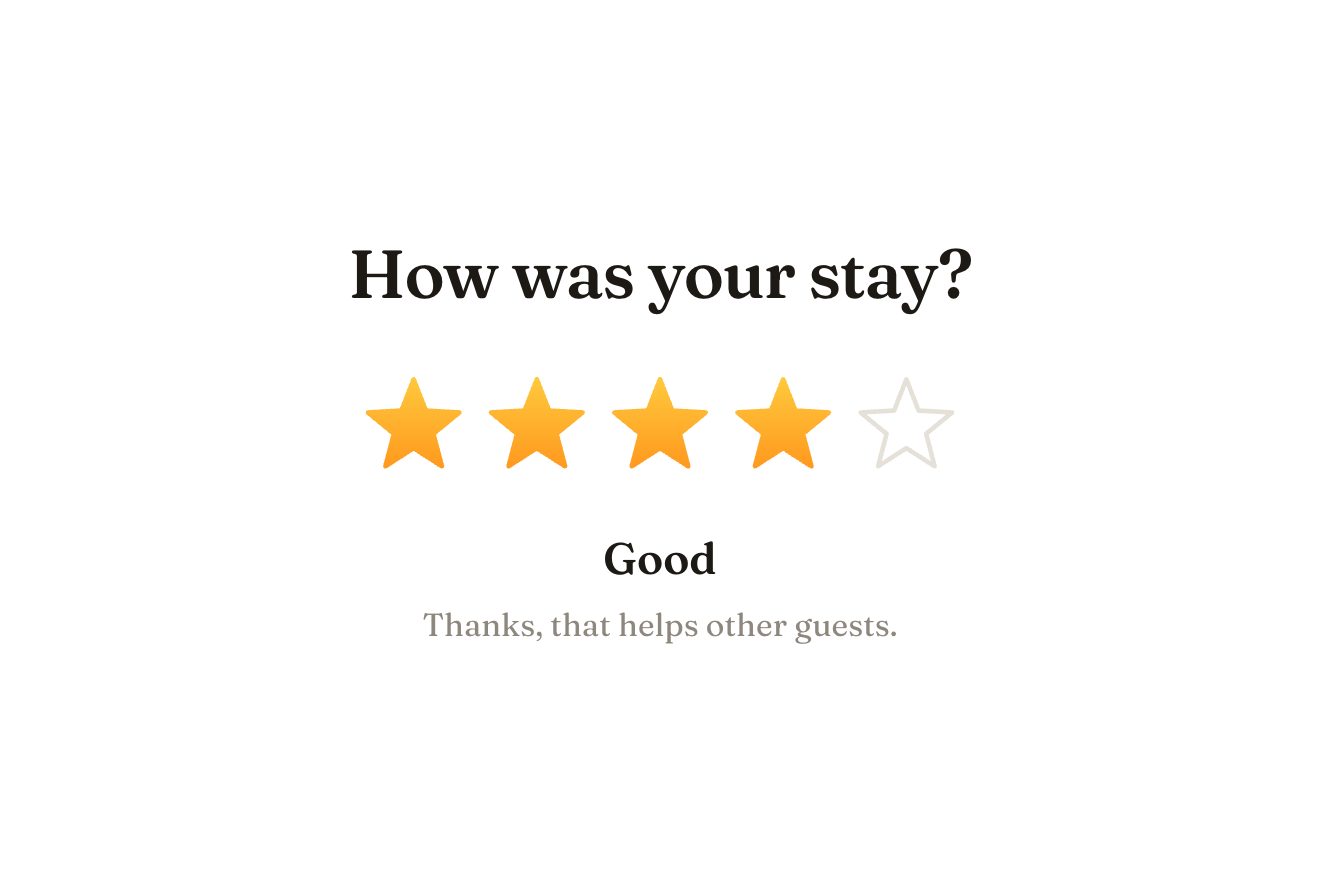
The star rating
Ratings, SVG, Hover
The stats card of Undertow, a made-up personal newsletter, alone on white in the premium product style. The Sunday letter goes out: the ring in the pill fills and turns into a tick, then the first day plays hour by hour: each bar rises on a spring, a thin persimmon line walks along with its light, the opens roll up digit by digit and the open rate climbs. Run over the bars and the big number rolls to the hour you point at; the button resends the letter to whoever has not opened it yet.
A folder that runs on its own: index.html, style.css, script.js and the libraries from a CDN. The React and Vue tabs hold the same demo as a ready component, which switches its animations off when it leaves the page.
<!doctype html>
<!--
  "Newsletter stats card" from Animorio · https://animorio.com
  License: free on your own sites and your clients’ sites, paid work included.
  Not for resale, redistribution, templates or code collections · https://animorio.com/en/license/
-->
<html lang="en">
<head>
  <meta charset="utf-8">
  <meta name="viewport" content="width=device-width, initial-scale=1">
  <title>The newsletter stats card with the opens climbing hour by hour</title>
  <link rel="stylesheet" href="https://cdn.jsdelivr.net/npm/@fontsource-variable/mona-sans@5.3.0/wdth.css">
  <link rel="stylesheet" href="style.css">
</head>
<body>
  <main class="stage">
    <!-- the stats card of a made-up personal newsletter: the Sunday letter goes out, the ring in the pill fills and
         turns into a tick, then the first day plays hour by hour: the bars rise, the opens roll up, the open rate climbs.
         Hover the bars and the big number rolls to that hour; press the button to resend to whoever has not opened it yet -->
    <section class="letter" data-letter aria-label="Newsletter stats">
      <span class="letter__rim" aria-hidden="true"></span>

      <header class="head">
        <span class="mark" aria-hidden="true">
          <svg viewBox="0 0 24 24"><path d="M4.5 7.5h15v9a2 2 0 0 1-2 2h-11a2 2 0 0 1-2-2Z" /><path d="m4.8 8 7.2 5.4L19.2 8" /></svg>
        </span>
        <span class="head__txt">
          <span class="head__name" data-brand>Undertow</span>
          <span class="head__sub">The Sunday letter</span>
        </span>
        <span class="pill" data-pill>
          <svg class="pill__ring" viewBox="0 0 16 16" aria-hidden="true">
            <circle class="pill__track" cx="8" cy="8" r="6" />
            <circle class="pill__arc" data-arc cx="8" cy="8" r="6" pathLength="1" />
            <path class="pill__tick" data-pilltick d="M5.2 8.3 7.1 10.1 10.9 6.2" pathLength="1" />
          </svg>
          <span class="pill__roll" data-pillroll><span class="pill__line">Sending</span></span>
        </span>
      </header>

      <div class="issue">
        <span class="issue__title">Why cities feel slower in the rain</span>
        <span class="issue__meta">To <b data-readers>12,480</b> readers · Sun, 08:00</span>
      </div>

      <div class="big">
        <div class="big__count">
          <span class="odo" data-odo aria-hidden="true"></span>
          <span class="sr" data-odosr>0 opens</span>
          <span class="big__label" data-labelroll><span class="big__line">opens</span></span>
        </div>
        <div class="big__rate">
          <span class="rate" data-rate>0.0%</span>
          <span class="delta" data-delta>
            <svg viewBox="0 0 12 12" aria-hidden="true"><path d="M6 9.5V2.8M3 5.6 6 2.6l3 3" /></svg>
            <span data-deltanum>4.1</span> pts
          </span>
        </div>
      </div>

      <div class="chart" data-chart role="img" aria-label="Opens per hour in the first day">
        <span class="chart__glow" data-glow aria-hidden="true"></span>
        <div class="chart__grid" aria-hidden="true"><i></i><i></i><i></i></div>
        <div class="bars" data-bars aria-hidden="true"></div>
        <span class="now" data-now aria-hidden="true"><span class="now__line"></span></span>
      </div>
      <div class="axis" aria-hidden="true"><span>08:00</span><span>14:00</span><span>20:00</span><span>Mon 08:00</span></div>

      <dl class="minis">
        <div class="mini"><dt>Clicks</dt><dd data-mini="0">0</dd></div>
        <div class="mini"><dt>Replies</dt><dd data-mini="1">0</dd></div>
        <div class="mini"><dt>Unsubscribed</dt><dd data-mini="2">0</dd></div>
      </dl>

      <button class="resend" type="button" data-resend>
        <span class="resend__face" data-resendface>
          <svg class="resend__icon" viewBox="0 0 20 20" aria-hidden="true">
            <g class="resend__plane" data-plane><path d="M3.2 9.6 16.6 3.6l-4.2 13-2.6-5.4Z" /><path d="m9.8 11.2 6.8-7.6" /></g>
            <circle class="resend__spin" data-spin cx="10" cy="10" r="6.2" pathLength="1" />
            <path class="resend__tick" data-resendtick d="M5.6 10.4 8.6 13.2 14.6 7" pathLength="1" />
          </svg>
          <span class="resend__roll" data-resendroll><span class="resend__line">Resend to non-openers</span></span>
        </span>
      </button>
    </section>

    <svg class="ghost" data-ghost viewBox="0 0 24 24" aria-hidden="true"><path d="M5 3.2 19.2 11l-6.3 1.6-3.3 5.9Z"></path></svg>
  </main>

  <script src="https://cdn.jsdelivr.net/npm/gsap@3.15.0/dist/gsap.min.js"></script>
  <script src="script.js"></script>
</body>
</html>Change values, colours and text with the controls and watch the animation respond live. Or write in the code yourself. Then download the folder with your changes.
40 values to change
With the Animorio connector, Claude Code, ChatGPT, Cursor or VS Code take it from here, guide included, and fit it into your project. Paste this request:
Take “Newsletter stats card” from Animorio and fit it into my siteThe opens come from readers and rate: the total is split over the twenty four hours with weights (the peak in the first hour, a small rise in the evening and the next morning), and what rounding leaves goes to the highest hour, so the sum always adds up.
Each figure is a column with the ten digits stacked, moved with yPercent by ten points per digit. When the number gets longer the columns are rebuilt, each starting from the digit that sat in the same place counting from the right, so the roll never jumps.
The bars are spans with their height in percent; GSAP only moves their scaleY from the bottom with an elastic, and the gradient paint is a child. The hour line and its light move to the x of the bar’s centre, read from getBoundingClientRect at the time, so a resize does not shift it.
The pointer on the chart gives the bar index from its x; the is-peek class dims the others, the big number rolls to that hour’s opens and the label rolls to another line. Off the chart it goes back to the total.
The pill’s ring, its tick and the button’s tick have pathLength 1, so they draw with strokeDashoffset from 1 to 0, with autoRound off so GSAP does not round them to whole pixels.
| Name | File | Default | What it changes |
|---|---|---|---|
READERS | script.js | 12480 | How many readers the letter goes to. |
OPEN_RATE | script.js | 63.4 | The open rate after the first day, in percent. |
DAY_TIME | script.js | 5 | How many seconds the demo takes to play the first twenty four hours. |
SPRING | script.js | 1 | How lively the springs are (0 none, 1.6 a lot). |
GLOW | script.js | 1 | How strong the light under the hour that is playing is (0 off). |
BRAND | script.js | "Undertow" | The name of the newsletter. |
LOOP | script.js | true | Left alone, the drawn pointer does the round again. |
In the dashboard of a newsletter or a personal blog, on the page that shows how the last issue did, in an app to write and send letters, in the report of an email campaign: anywhere a writer wants to watch the readers arrive and resend to those who are missing.
The card narrows to 92 vw and the vertical sizes use clamp with vh, so it fits the phone box; the chart is made of flexible bars that narrow with the width, and on touch resting a finger on a bar reads its hour. Below 470 pixels of height the times and the readers line are hidden.
No springs and no movement: the bars fade in, the digits change without rolling, the labels swap with fades, the paper plane fades instead of flying and the ticks appear already drawn. The drawn pointer is not shown, the demo still repeats.
GSAP 3.15.0, Mona Sans (font variabile) 5.3.0.
Compressed with gzip, the three demo files weigh 9.5 KB; the libraries: GSAP 28 KB.
Tested on 15 November 2026
Use it in your own projects and in your clients’ projects. Do not resell it or redistribute it as is. GSAP stays under its own Standard license. Full license.
Support Animorio
Animorio stays free thanks to the people who support it. If you like, buy us a coffee: it helps us make the next animations.
You asked for
We made it for you: it’s in the library, with the preview, the Playground and the code to copy.
An animation you can’t find, or a site to take apart in the journal: tell us which. We pick the next ones from here.
With your account’s email and password.
or with your email
You’re signed in as .
With your account, you can download the zip of every animation and every pack, for free.