Long shadow letters
Text, Scroll, 3D
Scroll inside the preview
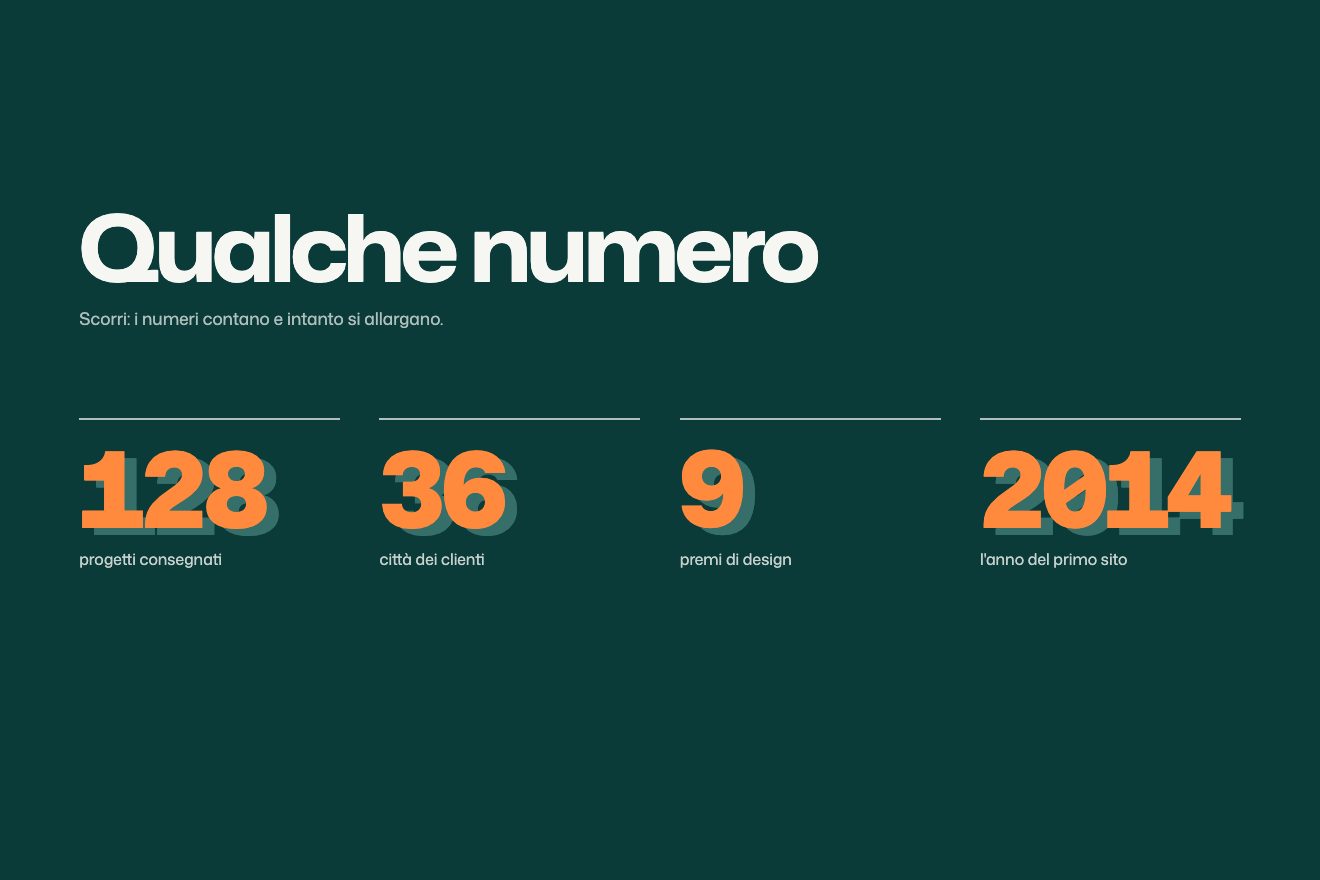
The numbers section of a product, in the clean style of product interfaces: as you scroll, four stats come in one after the other and every number rolls up digit by digit like an odometer, one wheel per digit, landing with a hair of bounce; a thin line fills underneath, the grey label slides in and each stat draws its own mark: a growth curve, the daily bars, five stars, a thin gauge.
A folder that runs on its own: index.html, style.css, script.js and the libraries from a CDN. The React and Vue tabs hold the same demo as a ready component, which switches its animations off when it leaves the page.
<!doctype html>
<!--
  "Scroll counters" from Animorio · https://animorio.com
  License: free on your own sites and your clients’ sites, paid work included.
  Not for resale, redistribution, templates or code collections · https://animorio.com/en/license/
-->
<html lang="en">
<head>
  <meta charset="utf-8">
  <meta name="viewport" content="width=device-width, initial-scale=1">
  <title>Pellum in numbers</title>
  <link rel="stylesheet" href="https://cdn.jsdelivr.net/npm/@fontsource-variable/mona-sans@5.3.0/wdth.css">
  <link rel="stylesheet" href="style.css">
</head>
<body>
  <!-- the numbers section of a made-up product, Pellum. The stage sticks while you scroll: four stats roll up digit
       by digit like an odometer, a thin line fills under each one, the grey label slides in after, and each stat
       draws its own small mark: a growth curve, a row of daily bars, five stars, a thin gauge -->
  <main>
    <section class="corsa" data-corsa>
      <div class="palco" data-palco>
        <header class="testa">
          <p class="testa__nota">Pellum in numbers</p>
          <h2 class="testa__titolo">Trusted by teams <span>that ship every day</span></h2>
        </header>

        <div class="numeri">
          <article class="dato" data-dato>
            <svg class="segno segno--curva" viewBox="0 0 160 56" preserveAspectRatio="none" aria-hidden="true">
              <defs>
                <linearGradient id="sotto" x1="0" y1="0" x2="0" y2="1">
                  <stop offset="0" stop-color="var(--accento)" stop-opacity=".18"/>
                  <stop offset="1" stop-color="var(--accento)" stop-opacity="0"/>
                </linearGradient>
              </defs>
              <path class="curva__area" data-area d="M0 50 C 30 48, 44 44, 62 38 S 100 26, 118 18 S 146 8, 160 5 L160 56 L0 56 Z"/>
              <path class="curva__linea" data-linea pathLength="1" d="M0 50 C 30 48, 44 44, 62 38 S 100 26, 118 18 S 146 8, 160 5"/>
              <circle class="curva__punta" data-punta cx="160" cy="5" r="3"/>
            </svg>
            <p class="cifra" data-cifra="12,000+"></p>
            <span class="filo"><span class="filo__pieno" data-filo></span></span>
            <p class="etichetta" data-etichetta>teams use Pellum <span>up 3x since 2024</span></p>
          </article>

          <article class="dato" data-dato>
            <svg class="segno segno--barre" viewBox="0 0 160 56" preserveAspectRatio="none" aria-hidden="true" data-barre></svg>
            <p class="cifra" data-cifra="99.99%"></p>
            <span class="filo"><span class="filo__pieno" data-filo></span></span>
            <p class="etichetta" data-etichetta>uptime <span>over the last 90 days</span></p>
          </article>

          <article class="dato" data-dato>
            <svg class="segno segno--stelle" viewBox="0 0 160 56" preserveAspectRatio="xMidYMid meet" aria-hidden="true" data-stelle>
              <defs>
                <clipPath id="taglio"><rect data-taglio x="0" y="0" width="0" height="56"/></clipPath>
              </defs>
            </svg>
            <p class="cifra" data-cifra="4.9" data-dopo="/5"></p>
            <span class="filo"><span class="filo__pieno" data-filo></span></span>
            <p class="etichetta" data-etichetta>average rating <span>from 2,340 reviews</span></p>
          </article>

          <article class="dato" data-dato>
            <svg class="segno segno--quadrante" viewBox="0 0 160 56" preserveAspectRatio="xMidYMid meet" aria-hidden="true">
              <path class="quadrante__fondo" d="M42 52 A 38 38 0 0 1 118 52"/>
              <path class="quadrante__arco" data-arco pathLength="1" d="M42 52 A 38 38 0 0 1 118 52"/>
              <g class="quadrante__tacche" data-tacche></g>
              <g data-ago transform="rotate(-90 80 52)">
                <line class="quadrante__ago" x1="80" y1="52" x2="80" y2="22"/>
              </g>
              <circle class="quadrante__perno" cx="80" cy="52" r="3"/>
            </svg>
            <p class="cifra" data-cifra="38" data-dopo="ms"></p>
            <span class="filo"><span class="filo__pieno" data-filo></span></span>
            <p class="etichetta" data-etichetta>median latency <span>across 14 regions</span></p>
          </article>
        </div>

        <p class="nota" data-nota>Figures updated October 2026</p>
      </div>
    </section>

    <footer class="piede">
      <p>Pellum keeps every release calm and on time.</p>
    </footer>
  </main>

  <script src="https://cdn.jsdelivr.net/npm/gsap@3.15.0/dist/gsap.min.js"></script>
  <script src="https://cdn.jsdelivr.net/npm/gsap@3.15.0/dist/ScrollTrigger.min.js"></script>
  <script src="https://cdn.jsdelivr.net/npm/lenis@1.3.26/dist/lenis.min.js"></script>
  <script src="script.js"></script>
</body>
</html>Change values, colours and text with the controls and watch the animation respond live. Or write in the code yourself. Then download the folder with your changes.
27 values to change
With the Animorio connector, Claude Code, ChatGPT, Cursor or VS Code take it from here, guide included, and fit it into your project. Paste this request:
Take “Scroll counters” from Animorio and fit it into my siteEvery digit becomes a 1 em tall column with hidden overflow holding a strip of repeated digits 0 to 9: to land on 8 with one extra turn the strip has nineteen digits and slides 18 out of 19, with yPercent, so it does not depend on the font size. The last two digits make one more turn than the others, as on an odometer. Commas, points, pluses and units stay still.
The strip slides with back.out: it goes a hair past the right digit and comes back, showing the top of the next digit as a real counter does. A soft mask at the top and bottom of the column fades the digits out instead of cutting them.
All four stats live in one paused timeline, staggered: the wheels, the line filling with scaleX, the label rising and each stat’s mark. One tween drives its time from start to end with the section’s ScrollTrigger (scrub of 0.6 seconds) and Lenis does the smooth scrolling. Never once: true on a timeline with ScrollTrigger.
The curve draws with pathLength 1 and stroke-dashoffset from 1 to 0; the thirty bars are rectangles built by the script that grow with attr y and height; the stars are outlines drawn as strokes plus a filled copy cut by a clipPath that widens to 4.9; the gauge colours its arc with the same stroke trick and turns its needle with svgOrigin around the pivot.
On every timeline update the script compares its time with each number’s landing and adds or removes the e-arrivato class: the card turns white with its shadow, and scrolling back up turns it grey again.
| Name | File | Default | What it changes |
|---|---|---|---|
RIDE | script.js | 1 | How much scroll the four stats take: 2 is twice as long. |
STAGGER | script.js | 0.22 | How much the stats overlap: the higher, the closer together they start. |
TURNS | script.js | 1 | How many extra turns every digit wheel makes before landing. |
BOUNCE | script.js | 1.3 | How much each digit overshoots before it settles (0 no bounce). |
SCRUB | script.js | 0.6 | How far the numbers lag behind the scroll, in seconds. |
For the stats section of the landing page of a SaaS product, an app, a service or a company: customers, uptime, ratings, response times; numbers rolling as you scroll make the data read one at a time instead of all at once.
The same animation with adapted sizes: the four cards become two by two and all fit in the box, numbers and marks shrink and the note at the bottom is hidden.
The numbers already show their value and the marks are already drawn; the cards only fade in, with no wheels and nothing tied to the scroll.
GSAP 3.15.0, ScrollTrigger 3.15.0, Lenis 1.3.26, Mona Sans (font variabile) 5.3.0.
Compressed with gzip, the three demo files weigh 6.8 KB; the libraries: GSAP + ScrollTrigger 45 KB, Lenis 5.3 KB.
Tested on 25 October 2026
Use it in your own projects and in your clients’ projects. Do not resell it or redistribute it as is. GSAP stays under its own Standard license. Full license.
Support Animorio
Animorio stays free thanks to the people who support it. If you like, buy us a coffee: it helps us make the next animations.
You asked for
We made it for you: it’s in the library, with the preview, the Playground and the code to copy.
An animation you can’t find, or a site to take apart in the journal: tell us which. We pick the next ones from here.
With your account’s email and password.
or with your email
You’re signed in as .
With your account, you can download the zip of every animation and every pack, for free.