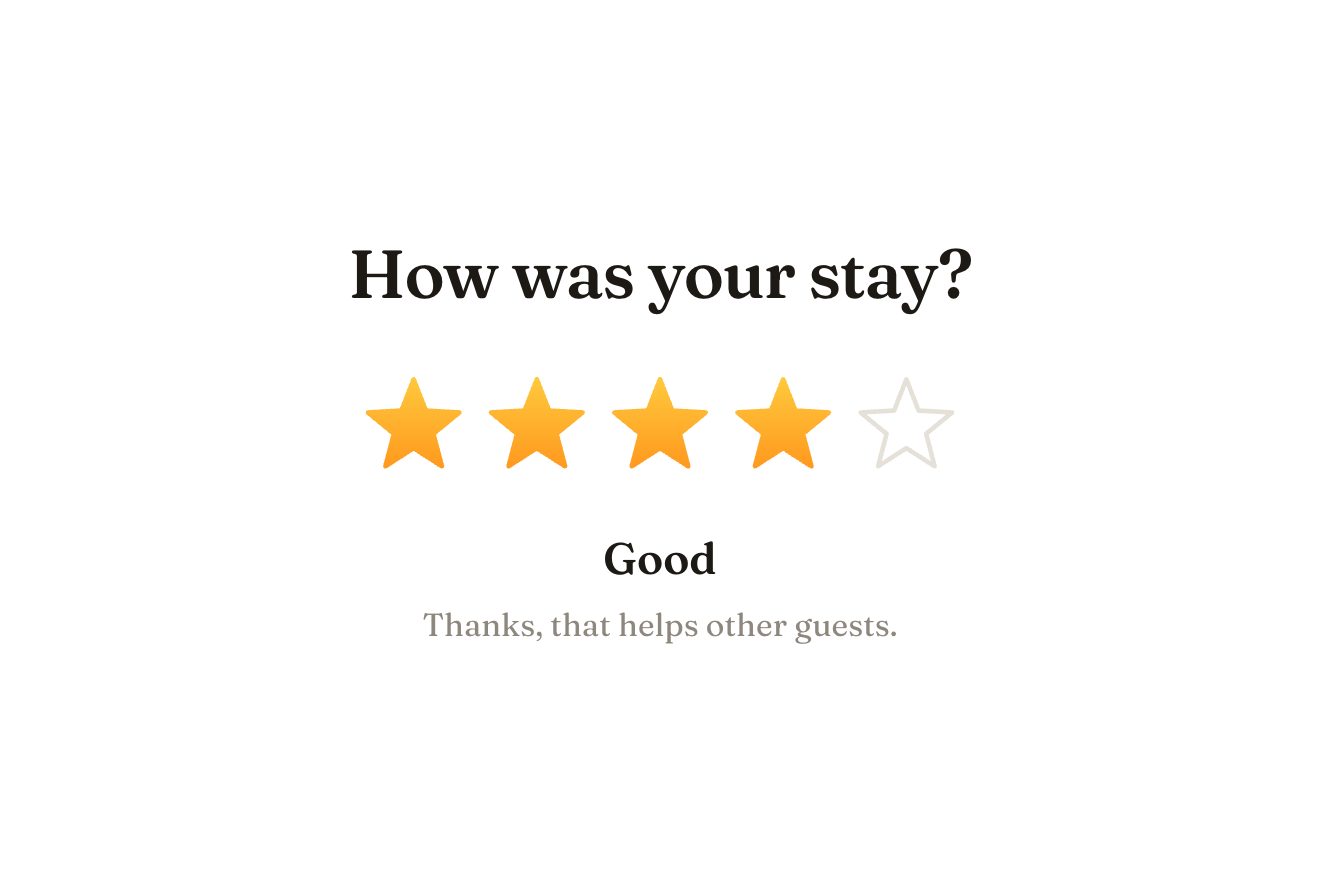
The star rating
Ratings, SVG, Hover
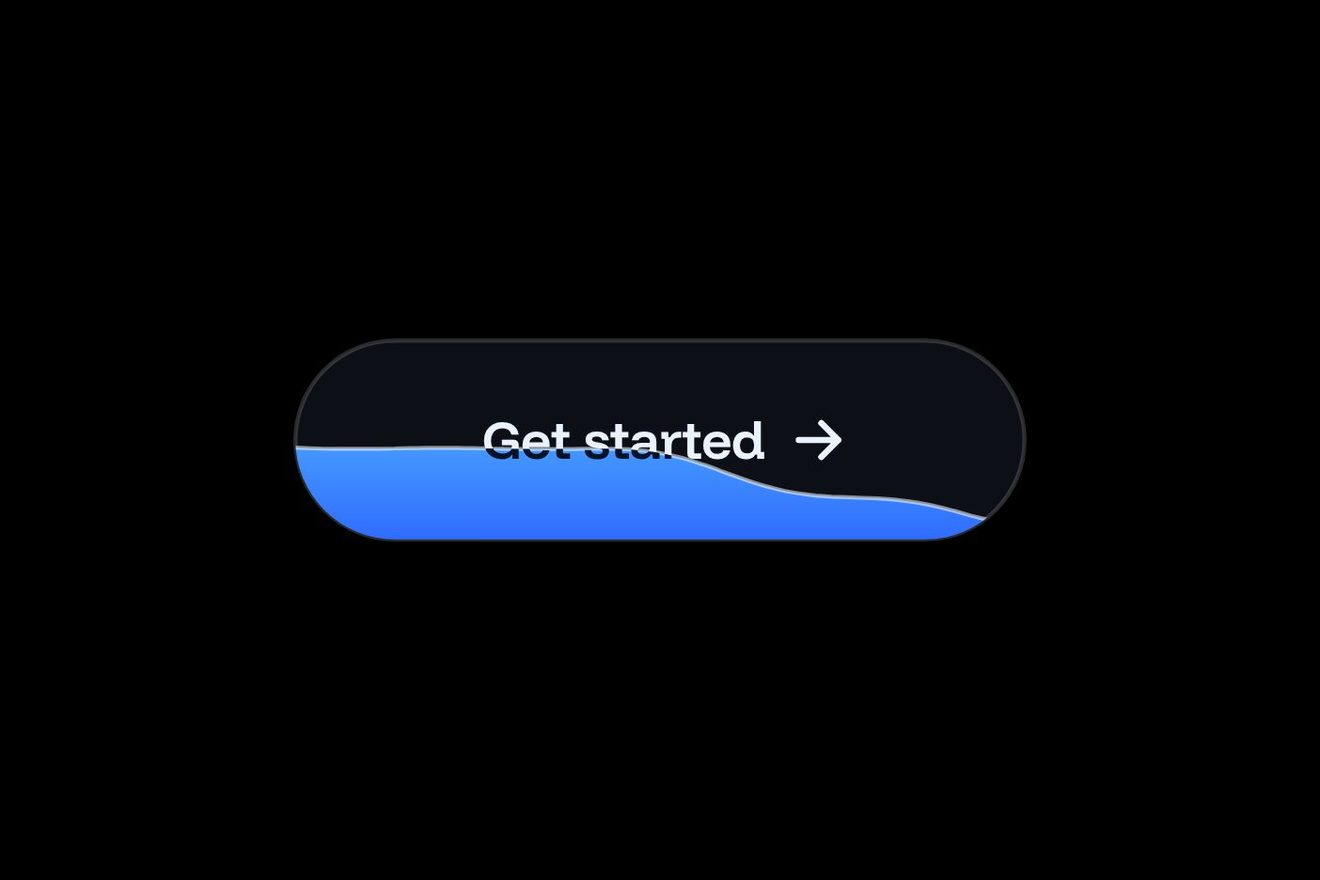
The button to track a flight’s price in a made-up travel app, Contrail: Lisbon to Copenhagen, Friday 14 March. The dark pill carries a small chart icon; on the tap the icon window grows on a spring and the fare curve of the last sixty days draws itself inside, with a reading line walking along it and the price in the label following it digit by digit. The line slows and stops on today’s fare, $214: its tick flares, the dashed alert line is laid back from there, then the window closes on a bell that swings, the edge lights up sky blue and the label says Tracking · $214.
A folder that runs on its own: index.html, style.css, script.js and the libraries from a CDN.
<!doctype html>
<!--
  "Flight price tracker button" from Animorio · https://animorio.com
  License: free on your own sites and your clients’ sites, paid work included.
  Not for resale, redistribution, templates or code collections · https://animorio.com/en/license/
-->
<html lang="en">
<head>
  <meta charset="utf-8">
  <meta name="viewport" content="width=device-width, initial-scale=1">
  <title>The Track prices button with the fare curve that stops on today's price</title>
  <link rel="stylesheet" href="https://cdn.jsdelivr.net/npm/@fontsource-variable/mona-sans@5.3.0/wdth.css">
  <link rel="stylesheet" href="style.css">
</head>
<body>
  <main class="stage">
    <!-- one gesture: watch a fare. Pressed, the little chart window opens and the fare curve of the last sixty days
         draws itself under a reading line, the price in the label follows it; the line slows and stops on today's
         fare, a dashed alert line is laid from there, and the window closes on a bell that swings -->
    <div class="frame" data-wrap>
      <button class="t" type="button" data-btn data-autoclic aria-describedby="t-note">
        <span class="t__skin" data-skin aria-hidden="true"></span>
        <span class="t__glow" data-glow aria-hidden="true"></span>
        <span class="t__rim" data-rim aria-hidden="true"></span>
        <span class="t__sheen" data-sheen aria-hidden="true"></span>
        <span class="t__win" data-win aria-hidden="true">
          <svg class="t__icon" data-icon viewBox="0 0 22 22"><path class="i__base" d="M3 17.5h16"></path><path class="i__line" d="M3 13.2l3.6-3.4 3.2 2.4 4-5.2 2.4 2.6L19 7"></path></svg>
          <svg class="t__chart" data-chart viewBox="0 0 84 30" preserveAspectRatio="xMinYMid meet">
            <defs>
              <linearGradient id="t-area" x1="0" y1="0" x2="0" y2="1">
                <stop offset="0" stop-color="var(--cielo)" stop-opacity="0.34"></stop>
                <stop offset="1" stop-color="var(--cielo)" stop-opacity="0"></stop>
              </linearGradient>
              <clipPath id="t-reveal"><rect data-reveal x="0" y="0" width="0" height="30"></rect></clipPath>
            </defs>
            <path class="c__grid" d="M0 7.5h84M0 15h84M0 22.5h84"></path>
            <path class="c__area" data-area clip-path="url(#t-reveal)" fill="url(#t-area)"></path>
            <path class="c__line" data-line></path>
            <line class="c__alert" data-alert x1="84" y1="0" x2="84" y2="0"></line>
          </svg>
          <span class="t__head" data-head><span class="t__tick" data-tick></span></span>
          <span class="t__bell" data-bell>
            <svg viewBox="0 0 22 22"><path class="b__body" d="M6.2 15.2V10a4.8 4.8 0 0 1 9.6 0v5.2l1.4 1.6H4.8Z"></path><path class="b__clap" d="M9.4 18.6a1.7 1.7 0 0 0 3.2 0"></path><path class="b__knob" d="M11 4.2v1"></path></svg>
          </span>
        </span>
        <span class="t__labels" data-labels>
          <span class="t__label" data-l="idle">Track prices</span>
          <span class="t__label" data-l="wait">Checking fares<span class="t__sep">·</span><span class="t__live">$<span data-live>248</span></span></span>
          <span class="t__label" data-l="done">Tracking<span class="t__sep">·</span><span class="t__num">$<span data-price>214</span></span></span>
        </span>
      </button>

      <p class="note" id="t-note" aria-live="polite">
        <span class="note__line" data-n="idle">Lisbon to Copenhagen<span class="t__sep">·</span>Fri 14 Mar<span class="t__sep">·</span>Contrail</span>
        <span class="note__line" data-n="done">We’ll ping you if it drops below $<span data-below>214</span></span>
      </p>
    </div>
  </main>

  <script src="https://cdn.jsdelivr.net/npm/gsap@3.15.0/dist/gsap.min.js"></script>
  <script src="script.js"></script>
</body>
</html>Change values, colours and text with the controls and watch the animation respond live. Or write in the code yourself. Then download the folder with your changes.
27 values to change
With the Animorio connector, Claude Code, ChatGPT, Cursor or VS Code take it from here, guide included, and fit it into your project. Paste this request:
Take “Flight price tracker button” from Animorio and fit it into my siteTwenty-four invented fares, one every two and a half days, become points in an 84 by 26 pixel window and a Catmull-Rom curve written as cubic Béziers; the last point is today’s price, and changing PRICE shifts the whole series with it.
A single power2.inOut tween takes the progress from 0 to 1: on each frame the stroke is uncovered with strokeDashoffset, getPointAtLength gives the point under the reading line, the rectangle that clips the area widens to it and the label shows the interpolated price in tabular figures, so its width does not shiver.
Once the reading stops, the dashed line starts from today and its x1 runs to zero. Then the window goes back to 22 pixels while the chart slides left by the same amount, so the last stretch stays in view until it goes.
The bell is a damped pendulum integrated on every frame of the GSAP ticker, hung from its knob: it gets a push when it arrives and another when the pointer comes back over the pill. The viewer pilot’s clicks start a round but do not end it: it comes back by itself after HOLD, a real tap does.
| Name | File | Default | What it changes |
|---|---|---|---|
PRICE | script.js | 214 | Today’s fare, where the curve stops. |
READ | script.js | 1.6 | The seconds the line takes to walk the sixty days. |
SWING | script.js | 1 | How much the bell swings. |
BOUNCE | script.js | 1.6 | How much the pill, the window and the labels bounce. |
HOLD | script.js | 2.6 | The seconds the autoplay leaves Tracking in view. |
--cielo | style.css | #7cc4ff | The sky blue of the curve, the area and the lit edge. |
--inchiostro | style.css | #121318 | The black of the pill. |
On the results page or the chosen flight of a travel app, an airline or a flight comparison site, next to the price: whoever is not ready to buy tracks the fare and gets an alert when it drops.
The pill drops to 56 pixels and the label tightens by a point; the finger taps like the mouse. Without hover the light stays off and the bell only swings as it arrives.
No reading line and no pendulum: the window opens at once with the curve already drawn, fading in, the labels change with a fade, then the bell and the sky-blue edge appear still.
GSAP 3.15.0, Mona Sans (font variabile) 5.3.0.
Compressed with gzip, the three demo files weigh 7.8 KB; the libraries: GSAP 28 KB.
Tested on 16 November 2026
Use it in your own projects and in your clients’ projects. Do not resell it or redistribute it as is. GSAP stays under its own Standard license. Full license.
Support Animorio
Animorio stays free thanks to the people who support it. If you like, buy us a coffee: it helps us make the next animations.
You asked for
We made it for you: it’s in the library, with the preview, the Playground and the code to copy.
An animation you can’t find, or a site to take apart in the journal: tell us which. We pick the next ones from here.
With your account’s email and password.
or with your email
You’re signed in as .
With your account, you can download the zip of every animation and every pack, for free.