The inchworm menu
Menus, Hover, Transitions
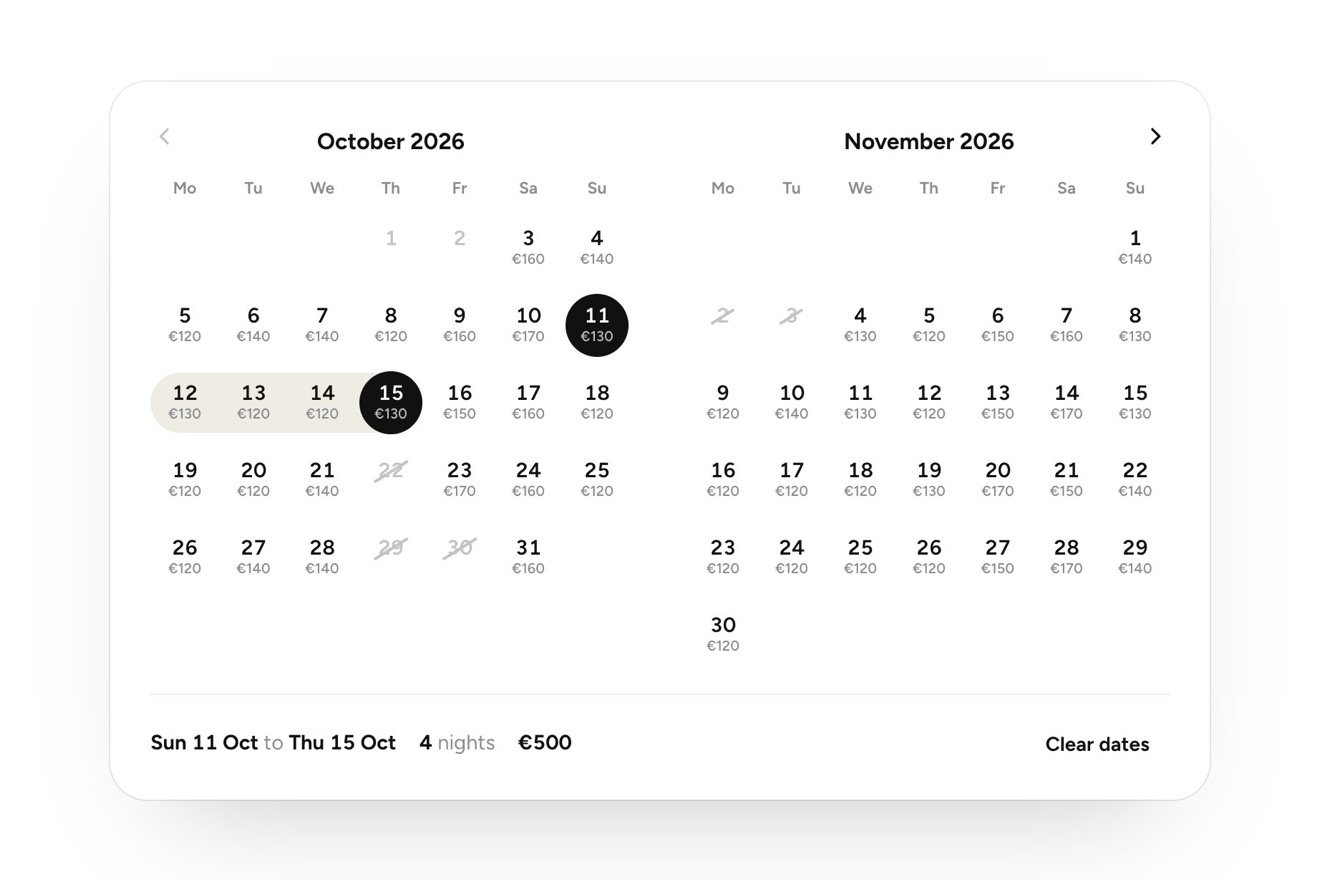
The date range picker of an analytics dashboard, Halcyon Analytics, on white like a Dribbble shot. The ‘Last 30 days’ button opens on a spring into a panel with the presets on the left (Today, Last 7 days, This quarter…) and two months side by side. Choosing a preset, the band of the period brushes across the days with a brighter wet head, the numbers light up as it passes and the two ends land with a pixel of bounce; the summary rolls letter by letter and below it the sessions and the two comparison bars against the previous period update. Days can also be picked by hand.
A folder that runs on its own: index.html, style.css, script.js and the libraries from a CDN. The React and Vue tabs hold the same demo as a ready component, which switches its animations off when it leaves the page.
<!doctype html>
<!--
"Date range with presets" from Animorio · https://animorio.com
License: free on your own sites and your clients’ sites, paid work included.
Not for resale, redistribution, templates or code collections · https://animorio.com/en/license/
-->
<html lang="en">
<head>
<meta charset="utf-8">
<meta name="viewport" content="width=device-width, initial-scale=1">
<title>The dashboard date range picker with presets and comparison</title>
<link rel="stylesheet" href="https://cdn.jsdelivr.net/npm/@fontsource-variable/mona-sans@5.3.0/wdth.css">
<link rel="stylesheet" href="style.css">
</head>
<body>
<main class="stage" data-stage>
<!-- the date range picker of an analytics dashboard (Halcyon Analytics). A button says the period; it opens on a
spring into a panel with the presets on the left and two months side by side. Picking a preset, the band of the
range brushes across the days and lights their numbers, the summary rolls and the bars of the comparison with
the period before grow or shrink -->
<div class="picker" data-picker>
<button class="trigger" type="button" data-trigger aria-haspopup="dialog" aria-expanded="false" aria-controls="range-panel">
<span class="trigger__body" data-trigger-body>
<svg class="trigger__cal" viewBox="0 0 20 20" aria-hidden="true">
<rect x="3" y="4.2" width="14" height="12.6" rx="2.6"/>
<path d="M3 8.2h14M7 2.6v3M13 2.6v3"/>
<path class="trigger__cal-fill" d="M6.4 11h2.2v2.2H6.4z"/>
</svg>
<span class="roll trigger__label" data-trig-label>Last 30 days</span>
<span class="trigger__sep" aria-hidden="true"></span>
<span class="roll trigger__range" data-trig-range>Oct 7 – Nov 5</span>
<svg class="trigger__chev" data-chev viewBox="0 0 20 20" aria-hidden="true"><path d="M6 8l4 4 4-4"/></svg>
</span>
</button>
<section class="panel" id="range-panel" data-panel role="dialog" aria-label="Choose a date range" aria-hidden="true">
<div class="panel__grain" aria-hidden="true"></div>
<ul class="presets" data-presets>
<li class="presets__item"><button type="button" class="preset" data-preset="today"><span class="preset__long">Today</span><span class="preset__short">Today</span></button></li>
<li class="presets__item presets__item--wide"><button type="button" class="preset" data-preset="yesterday"><span class="preset__long">Yesterday</span><span class="preset__short">Yesterday</span></button></li>
<li class="presets__item"><button type="button" class="preset" data-preset="last7"><span class="preset__long">Last 7 days</span><span class="preset__short">7D</span></button></li>
<li class="presets__item"><button type="button" class="preset" data-preset="last30"><span class="preset__long">Last 30 days</span><span class="preset__short">30D</span></button></li>
<li class="presets__item presets__item--wide"><button type="button" class="preset" data-preset="month"><span class="preset__long">This month</span><span class="preset__short">Month</span></button></li>
<li class="presets__item"><button type="button" class="preset" data-preset="quarter"><span class="preset__long">This quarter</span><span class="preset__short">QTD</span></button></li>
<li class="presets__item"><button type="button" class="preset" data-preset="last90"><span class="preset__long">Last 90 days</span><span class="preset__short">90D</span></button></li>
<li class="presets__item presets__item--custom"><span class="preset preset--custom" data-custom><span class="preset__long">Custom</span><span class="preset__short">Custom</span></span></li>
<li class="presets__pill" data-pill aria-hidden="true"></li>
</ul>
<div class="months" data-months>
<div class="month" data-month>
<div class="month__head">
<button type="button" class="month__nav" data-nav="-1" aria-label="Previous month"><svg viewBox="0 0 20 20" aria-hidden="true"><path d="M12 5.5L7.5 10l4.5 4.5"/></svg></button>
<span class="month__name" data-month-name></span>
</div>
<div class="month__week" aria-hidden="true"><span>Mo</span><span>Tu</span><span>We</span><span>Th</span><span>Fr</span><span>Sa</span><span>Su</span></div>
<div class="grid" data-grid></div>
</div>
<div class="month" data-month>
<div class="month__head">
<span class="month__name" data-month-name></span>
<button type="button" class="month__nav month__nav--next" data-nav="1" aria-label="Next month"><svg viewBox="0 0 20 20" aria-hidden="true"><path d="M8 5.5l4.5 4.5L8 14.5"/></svg></button>
</div>
<div class="month__week" aria-hidden="true"><span>Mo</span><span>Tu</span><span>We</span><span>Th</span><span>Fr</span><span>Sa</span><span>Su</span></div>
<div class="grid" data-grid></div>
</div>
</div>
<footer class="foot">
<div class="sum">
<p class="sum__main"><span class="roll" data-sum-range>Oct 7 – Nov 5</span><span class="sum__dot">·</span><span class="roll" data-sum-days>30 days</span></p>
<p class="sum__vs">vs <span class="roll" data-sum-prev>Sep 7 – Oct 6</span></p>
</div>
<div class="cmp">
<p class="cmp__top">
<span class="cmp__label">Sessions</span>
<span class="roll cmp__value" data-sessions>0</span>
<span class="delta" data-delta>
<svg class="delta__arrow" data-delta-arrow viewBox="0 0 12 12" aria-hidden="true"><path d="M6 9.4V2.8M3.2 5.4L6 2.6l2.8 2.8"/></svg>
<span class="roll" data-delta-text>0%</span>
</span>
</p>
<div class="bars" aria-hidden="true">
<span class="bars__track"><i class="bars__fill bars__fill--now" data-bar-now></i></span>
<span class="bars__track"><i class="bars__fill bars__fill--prev" data-bar-prev></i></span>
</div>
</div>
<div class="acts">
<button type="button" class="btn btn--ghost" data-cancel><span class="btn__face">Cancel</span></button>
<button type="button" class="btn btn--main" data-apply><span class="btn__face"><span class="btn__shine" aria-hidden="true"></span>Apply</span></button>
</div>
</footer>
</section>
</div>
<!-- the drawn pointer of the autopilot -->
<svg class="hand" data-hand viewBox="0 0 24 24" aria-hidden="true">
<path d="M5 2.8l13.4 9.6-6.1.9 3.6 7-2.6 1.3-3.6-7-4.7 4.2z"/>
</svg>
<p class="sr" aria-live="polite" data-live></p>
</main>
<script src="https://cdn.jsdelivr.net/npm/gsap@3.15.0/dist/gsap.min.js"></script>
<script src="script.js"></script>
</body>
</html>Change values, colours and text with the controls and watch the animation respond live. Or write in the code yourself. Then download the folder with your changes.
60 values to change
With the Animorio connector, Claude Code, ChatGPT, Cursor or VS Code take it from here, guide included, and fit it into your project. Paste this request:
Take “Date range with presets” from Animorio and fit it into my siteEvery date is a number of days since 1970 (Date.UTC divided by 86400000): the presets are pairs of numbers worked out from today (the last 30 days end yesterday, the quarter starts on the first of its first month) and the previous period is the same number of days right before. The sessions of each day come from a fixed rule (busier weekdays, a slow growth, a seeded wobble), so the comparison is the same on every loop.
Under the numbers of each month there is a layer with six strips, one per week. The band is an interval [start, end) in fractional days: on every frame each strip takes its part and rounds only the real ends, not those cut by the end of the week. GSAP moves the end from the start to the last day with power3.inOut, takes it a tenth of a day past and settles it back: that is the brushstroke, with the bright head (a gradient) following the growing edge.
A number turns iris, bolder and a little wider (Mona Sans wdth axis) as soon as the band covers its middle: the classes change every frame and CSS transitions do the rest, so they light up one after another as it passes. The two ends are separate tiles born with a back.out when the stroke reaches them.
Every label that changes (the summary, the previous period, the sessions, the percentage, the button's label) is split into letters: the old ones rise away, the new ones come in from below with a stagger and a back.out, and the width grows or shrinks on a spring. Letters that are equal at the same place, counted from the right, stay still.
The presets pill measures the chosen button and slides onto it with a back.out (vertically on desktop, horizontally among the five short labels on the phone). The panel opens with scale, drop and fade on a spring from the button's corner; the layout changes with a container query on the picker's width.
| Name | File | Default | What it changes |
|---|---|---|---|
SWEEP | script.js | 0.8 | How many seconds the band takes to brush across the days of a new period. |
SPRING | script.js | 1 | How springy the panel, the pill and the ends are: 0.5 calm, 2 very bouncy. |
SESSIONS | script.js | 1640 | The dashboard's average sessions per day, behind the comparison. |
SPEED | script.js | 1 | 2 = the drawn pointer twice as fast, 0.5 = half. |
AUTO | script.js | true | The drawn pointer uses the picker by itself until someone touches it. |
For the top bar of an analytics, sales or marketing dashboard, the admin panel of a SaaS app, the reports of an online shop or a booking service: wherever people pick the period of the data and need to see straight away how it compares with before.
On the phone the presets become a row of five short labels (Today, 7D, 30D, QTD, 90D) with the pill sliding sideways, the two months stay side by side with smaller cells, the summary sits next to the buttons and the bars below. Tap the first day and then the last. The rest is the same.
Nothing moves: the panel fades in, the band appears whole with a fade instead of brushing across, the labels change with a fade and the bars are already at their size; the drawn pointer is not shown.
GSAP 3.15.0, Mona Sans (font variabile) 5.3.0.
Compressed with gzip, the three demo files weigh 14 KB; the libraries: GSAP 28 KB.
Tested on 6 November 2026
Use it in your own projects and in your clients’ projects. Do not resell it or redistribute it as is. GSAP stays under its own Standard license. Full license.
Support Animorio
Animorio stays free thanks to the people who support it. If you like, buy us a coffee: it helps us make the next animations.
You asked for
We made it for you: it’s in the library, with the preview, the Playground and the code to copy.
An animation you can’t find, or a site to take apart in the journal: tell us which. We pick the next ones from here.
With your account’s email and password.
or with your email
You’re signed in as .
With your account, you can download the zip of every animation and every pack, for free.